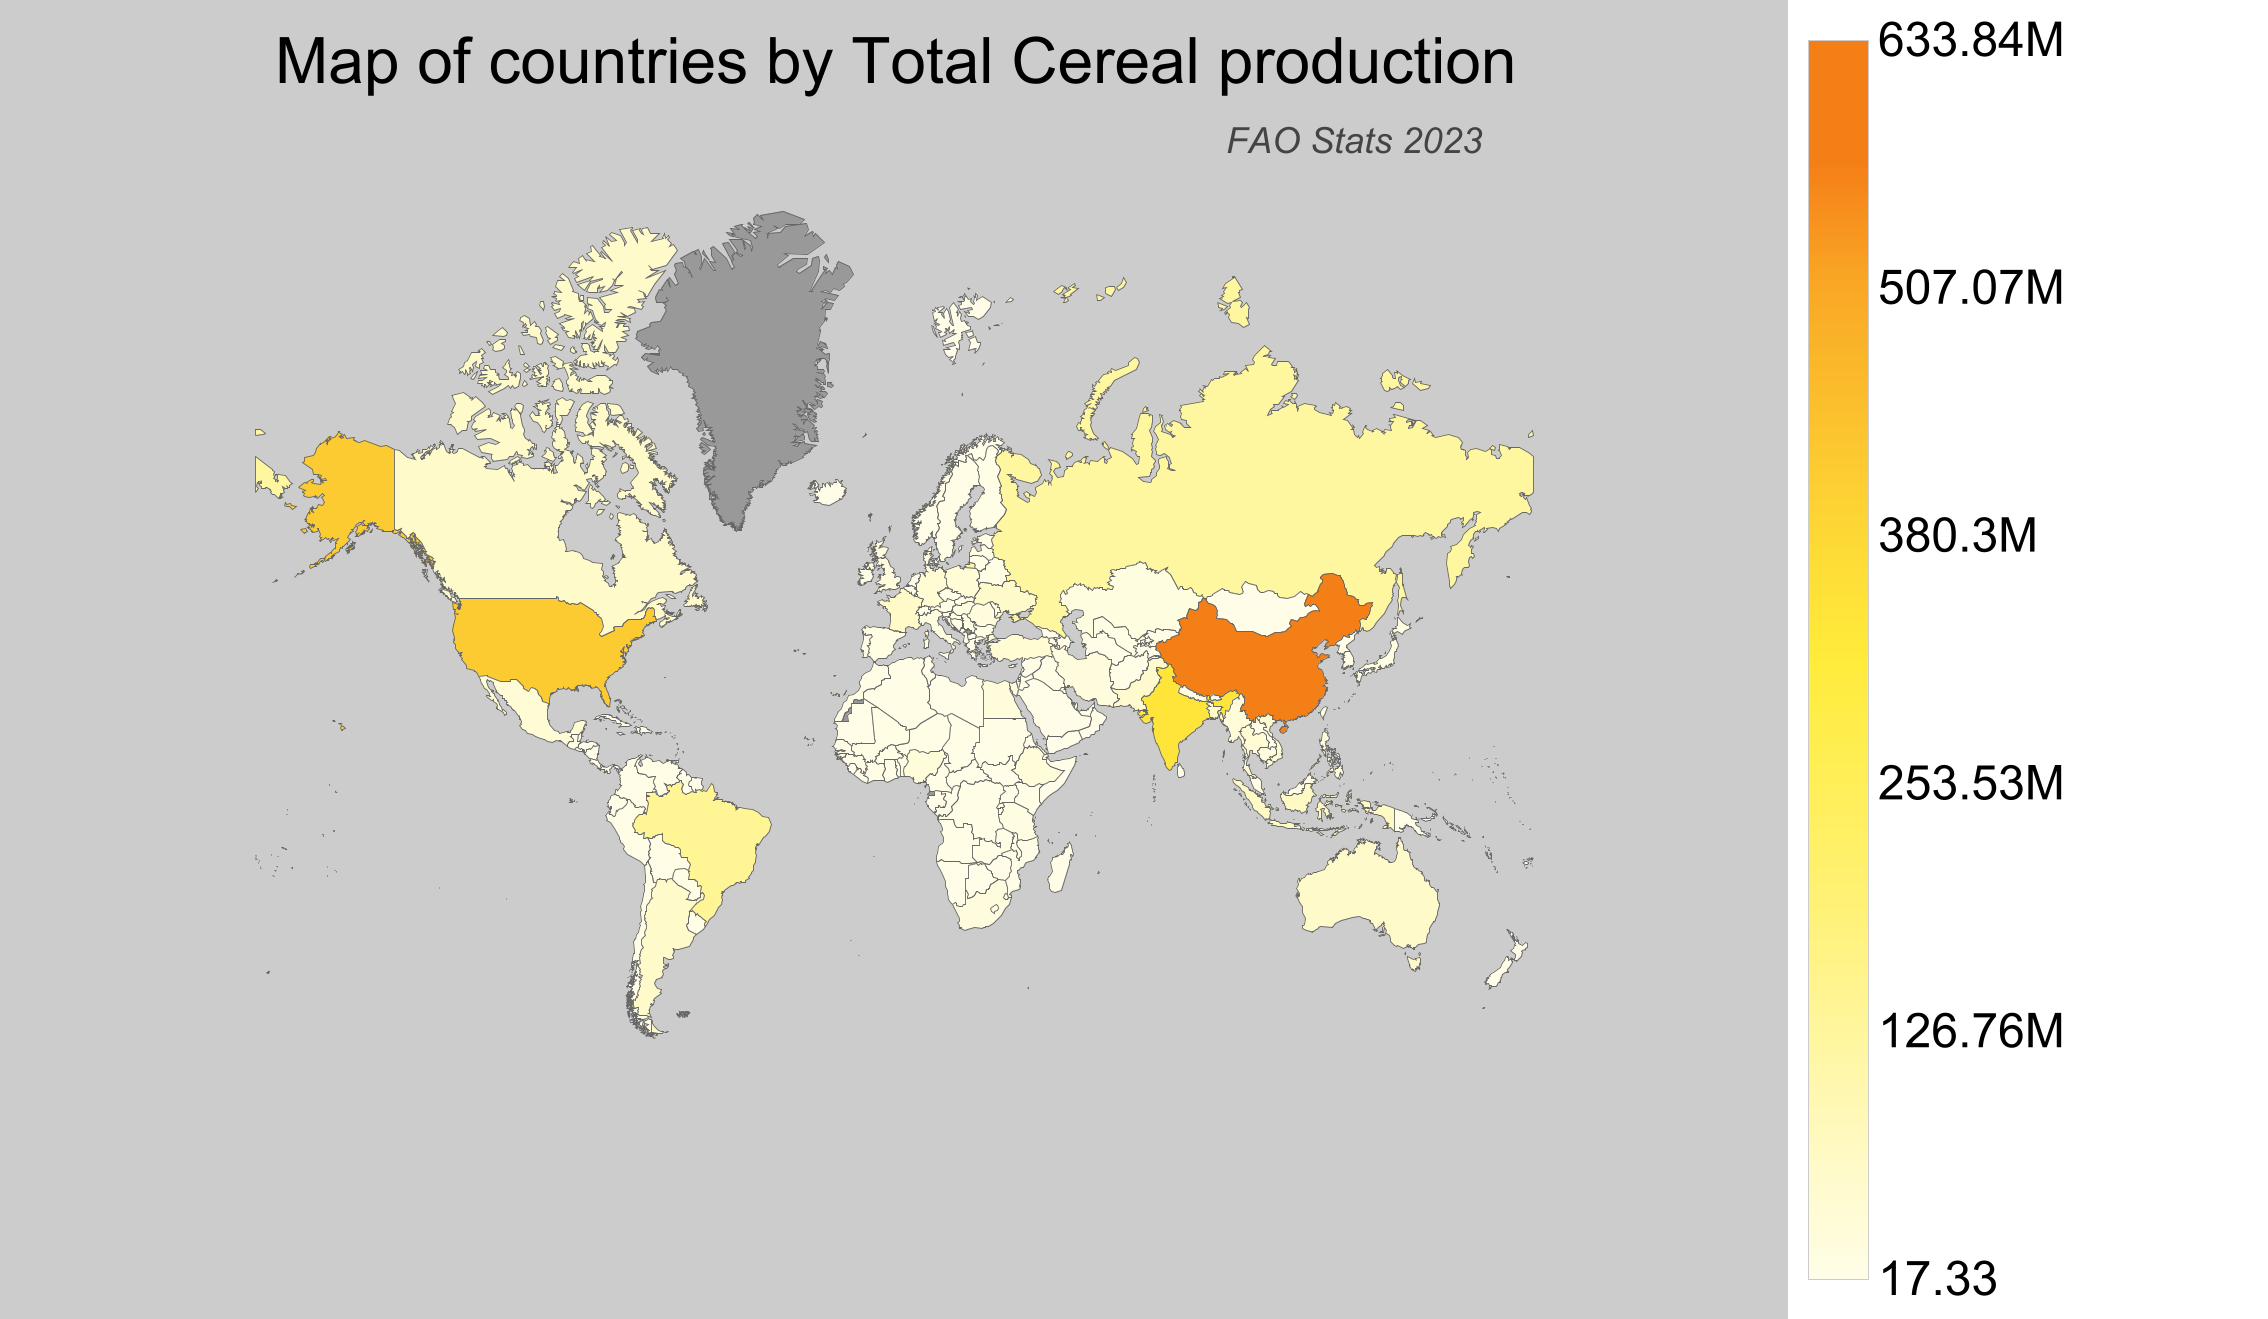
Countries by Total Cereal production
Total Cereal is a crucial component of global agriculture, providing a vital food source for millions worldwide. It thrives in a variety of climates, from temperate to tropical, making it an essential crop across diverse regions. The data presented here is for the year 2023, the latest available from the Food and Agriculture Organization (FAO) stats database as of 2025.
Global Total Cereal Production
In 2023, the global Total Cereal production reached approximately 3.1 billion tonnes, marking a steady increase over the decades since 1961 when production was around 877 million tonnes. Noteworthy milestones include surpassing 2 billion tonnes in the 1990s. This continued growth highlights advancements in agricultural practices and technologies over a span of more than 60 years.
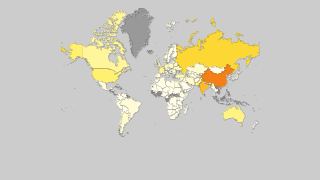
Total Cereal Production by Country
- China leads the world with a production of about 634 million tonnes of Total Cereal in 2023, showcasing its strong agricultural capabilities.
- The United States of America follows closely, producing roughly 463 million tonnes, underscoring its prominent role in global cereal markets.
- India contributes significantly with around 375 million tonnes, highlighting its position as a key player in cereal production.
- Brazil, with approximately 156 million tonnes, demonstrates its growing impact in global cereal production.
- Canada produced nearly 59 million tonnes of Total Cereal, securing its place as an important producer even outside the top four.
| Country | Production (tonnes) | Production per Person (kg) | Harvested Area (ha) | Yield (kg/ha) |
|---|---|---|---|---|
 China China |
633,846,950.03 | 454.742 | 100,278,968 | 6.321 |
 United States of America United States of America |
462,631,789.82 | 1,411.474 | 55,539,765 | 8.33 |
 India India |
374,600,068.56 | 280.289 | 103,299,119 | 3.626 |
 Brazil Brazil |
155,877,474.39 | 743.928 | 29,210,869 | 5.336 |
 Russian Federation Russian Federation |
136,708,406.91 | 930.767 | 43,171,705 | 3.167 |
 Indonesia Indonesia |
73,966,646 | 279.103 | 12,689,796 | 5.829 |
 Bangladesh Bangladesh |
64,325,662.39 | 389.555 | 12,466,498 | 5.16 |
 France France |
64,240,810 | 954.587 | 8,831,520 | 7.274 |
 Argentina Argentina |
62,106,556.9 | 1,395.825 | 16,293,288 | 3.812 |
 Ukraine Ukraine |
59,307,681.94 | 1,403.271 | 10,634,188 | 5.577 |
 Canada Canada |
59,240,420.77 | 1,591.902 | 16,033,993 | 3.695 |
 Australia Australia |
59,043,989 | 2,357.102 | 18,275,967 | 3.231 |
 Pakistan Pakistan |
53,188,016 | 263.474 | 14,636,120 | 3.634 |
 Vietnam Vietnam |
47,935,652.71 | 506.398 | 7,995,586 | 5.995 |
 Germany Germany |
42,462,800 | 513.202 | 6,059,800 | 7.007 |
 Turkey Turkey |
42,193,311 | 494.227 | 11,531,027 | 3.659 |
 Thailand Thailand |
38,532,088.18 | 556.958 | 12,544,291 | 3.072 |
 Mexico Mexico |
37,015,878.83 | 296.75 | 8,684,694 | 4.262 |
 Poland Poland |
35,183,860 | 915.445 | 7,188,220 | 4.895 |
 Ethiopia Ethiopia |
30,146,269.6 | 280.339 | 10,526,584 | 2.864 |
 Philippines Philippines |
28,465,199.05 | 267.507 | 7,356,944 | 3.869 |
 Myanmar Myanmar |
28,285,634.18 | 525.143 | 7,459,299 | 3.792 |
 Nigeria Nigeria |
28,053,832.88 | 142.118 | 18,116,278 | 1.549 |
 Egypt Egypt |
23,391,009.98 | 239.916 | 3,160,027 | 7.402 |
 United Kingdom United Kingdom |
22,047,420 | 333.848 | 3,088,787 | 7.138 |
 Iran Iran |
20,964,153.27 | 256.421 | 8,661,544 | 2.42 |
 Romania Romania |
20,784,510 | 1,064.562 | 5,169,230 | 4.021 |
 South Africa South Africa |
19,009,087.33 | 329.301 | 3,319,721 | 5.726 |
 Kazakhstan Kazakhstan |
17,081,437.58 | 934.822 | 16,466,249 | 1.037 |
 Italy Italy |
15,452,820 | 255.687 | 3,054,290 | 5.059 |
 Hungary Hungary |
15,039,690 | 1,539.217 | 2,405,570 | 6.252 |
 Cambodia Cambodia |
14,380,000 | 894.839 | 3,863,387 | 3.722 |
 Tanzania Tanzania |
12,789,232.32 | 235.967 | 6,521,443 | 1.961 |
 Spain Spain |
11,928,280 | 255.646 | 5,444,490 | 2.191 |
 Japan Japan |
11,498,533.52 | 90.905 | 1,841,210 | 6.245 |
 Nepal Nepal |
11,150,994.25 | 381.637 | 3,334,346 | 3.344 |
 Serbia Serbia |
10,833,519.42 | 1,547.326 | 1,774,288 | 6.106 |
 Bulgaria Bulgaria |
10,345,650 | 1,467.461 | 1,980,470 | 5.224 |
 Mali Mali |
9,979,190.21 | 522.26 | 6,285,756 | 1.588 |
 Czech Republic Czech Republic |
7,995,530 | 753.346 | 1,317,200 | 6.07 |
 Uzbekistan Uzbekistan |
7,911,754.68 | 242.291 | 1,480,604 | 5.344 |
 Belarus Belarus |
7,053,123.71 | 744.142 | 2,065,826 | 3.414 |
 Denmark Denmark |
7,001,960 | 1,209.328 | 1,234,540 | 5.672 |
 Paraguay Paraguay |
6,872,271.79 | 974.378 | 1,533,143 | 4.482 |
 Ghana Ghana |
5,765,040.5 | 194.671 | 2,145,055 | 2.688 |
 Morocco Morocco |
5,674,770.52 | 163.187 | 3,795,996 | 1.495 |
 Lithuania Lithuania |
5,629,750 | 2,010.095 | 1,344,490 | 4.187 |
 Peru Peru |
5,504,339.39 | 176.21 | 1,148,876 | 4.791 |
 Madagascar Madagascar |
5,389,921.52 | 205.23 | 2,222,098 | 2.426 |
 Afghanistan Afghanistan |
5,371,824.12 | 170.129 | 2,340,211 | 2.295 |
 Guinea Guinea |
5,292,501.76 | 445.365 | 3,861,262 | 1.371 |
 Austria Austria |
5,235,050 | 592.323 | 742,450 | 7.051 |
 Iraq Iraq |
5,224,352.42 | 132.801 | 1,900,509 | 2.749 |
 Niger Niger |
5,162,204.46 | 240.473 | 10,562,506 | 0.489 |
 Burkina Faso Burkina Faso |
5,147,923.87 | 254.293 | 4,215,867 | 1.221 |
 Kenya Kenya |
5,146,069.64 | 101.001 | 2,928,050 | 1.758 |
 South Korea South Korea |
5,134,022.24 | 99.429 | 776,099 | 6.615 |
 Colombia Colombia |
4,987,440 | 99.891 | 1,151,014 | 4.333 |
 Syria Syria |
4,878,705 | 266.823 | 2,688,604 | 1.815 |
 Sri Lanka Sri Lanka |
4,744,648 | 221.258 | 1,247,195 | 3.804 |
 North Korea North Korea |
4,376,156.44 | 170.872 | 1,223,642 | 3.576 |
 Sweden Sweden |
4,328,000 | 425.502 | 971,160 | 4.457 |
 Slovakia Slovakia |
4,304,610 | 790.835 | 694,170 | 6.201 |
 Laos Laos |
4,285,000 | 615.554 | 966,190 | 4.435 |
 Senegal Senegal |
4,253,209.96 | 270.457 | 1,940,235 | 2.192 |
 Congo-Kinshasa Congo-Kinshasa |
4,207,501.57 | 51.727 | 5,017,653 | 0.839 |
 Sudan Sudan |
4,162,153.24 | 102.021 | 9,267,249 | 0.449 |
 Uruguay Uruguay |
3,937,366.83 | 1,123.042 | 857,114 | 4.594 |
 Cameroon Cameroon |
3,859,032.66 | 162.184 | 2,169,003 | 1.779 |
 Malawi Malawi |
3,795,155.5 | 211.646 | 2,043,825 | 1.857 |
 Zambia Zambia |
3,658,965.82 | 216.664 | 1,561,098 | 2.344 |
 Algeria Algeria |
3,589,552.61 | 84.369 | 2,907,539 | 1.235 |
 Greece Greece |
3,404,050 | 316.121 | 822,260 | 4.14 |
 Côte d'Ivoire Côte d'Ivoire |
3,390,058.49 | 136.115 | 1,413,839 | 2.398 |
 Uganda Uganda |
3,380,000 | 87.062 | 1,620,000 | 2.086 |
 Angola Angola |
3,335,449 | 114.032 | 3,141,276 | 1.062 |
 Bolivia Bolivia |
3,226,596.67 | 285.355 | 1,580,956 | 2.041 |
 Croatia Croatia |
3,191,010 | 761.197 | 539,590 | 5.914 |
 Moldova Moldova |
3,177,124.1 | 894.738 | 925,199 | 3.434 |
 Azerbaijan Azerbaijan |
3,153,905.6 | 318.638 | 936,377 | 3.368 |
 Finland Finland |
3,006,670 | 544.895 | 908,230 | 3.31 |
 Belgium Belgium |
2,754,890 | 241.303 | 324,650 | 8.486 |
 Ecuador Ecuador |
2,754,159.42 | 161.377 | 684,219 | 4.025 |
 Benin Benin |
2,737,481.16 | 240.927 | 2,429,628 | 1.127 |
 Latvia Latvia |
2,715,800 | 1,410.292 | 763,400 | 3.558 |
 Chad Chad |
2,643,417 | 172.174 | 3,226,254 | 0.819 |
 Chile Chile |
2,497,164.62 | 142.094 | 391,262 | 6.382 |
 Mozambique Mozambique |
2,459,322 | 85.21 | 3,333,705 | 0.738 |
 Guatemala Guatemala |
2,184,608.77 | 126.263 | 1,199,195 | 1.822 |
 Malaysia Malaysia |
2,167,306.44 | 66.368 | 615,072 | 3.524 |
 Venezuela Venezuela |
2,101,402.38 | 66.023 | 515,056 | 4.08 |
 Ireland Ireland |
1,879,540 | 386.975 | 269,360 | 6.978 |
 Taiwan Taiwan |
1,780,039.23 | 75.5 | 261,198 | 6.815 |
 Kyrgyzstan Kyrgyzstan |
1,671,536.41 | 264.932 | 597,282 | 2.799 |
 Sierra Leone Sierra Leone |
1,536,756.31 | 199.069 | 1,045,605 | 1.47 |
 Togo Togo |
1,514,448.12 | 205.991 | 1,290,998 | 1.173 |
 The Netherlands The Netherlands |
1,499,400 | 86.915 | 186,050 | 8.059 |
 Turkmenistan Turkmenistan |
1,468,654.8 | 250.989 | 800,694 | 1.834 |
 Tajikistan Tajikistan |
1,369,010.55 | 153.287 | 377,259 | 3.629 |
 Estonia Estonia |
1,200,650 | 910.181 | 352,150 | 3.409 |
 Saudi Arabia Saudi Arabia |
1,192,998.83 | 35.704 | 232,932 | 5.122 |
 Zimbabwe Zimbabwe |
1,167,830.07 | 78.648 | 1,569,913 | 0.744 |
 South Sudan South Sudan |
1,086,000 | 88.125 | 1,104,151 | 0.984 |
 Burundi Burundi |
1,072,549.83 | 100.415 | 778,541 | 1.378 |
 Bosnia and Herzegovina Bosnia and Herzegovina |
1,062,500 | 280.757 | 192,144 | 5.53 |
 Portugal Portugal |
1,042,940 | 101.345 | 189,560 | 5.502 |
 Dominican Republic Dominican Republic |
1,028,927.37 | 100.225 | 230,247 | 4.469 |
 Guyana Guyana |
999,000 | 1,277.126 | 165,725 | 6.028 |
 New Zealand New Zealand |
960,177.34 | 195.91 | 116,464 | 8.244 |
 Nicaragua Nicaragua |
881,420.38 | 140.247 | 350,425 | 2.515 |
 El Salvador El Salvador |
881,000 | 132.614 | 318,956 | 2.762 |
 Rwanda Rwanda |
846,384.42 | 70.525 | 527,326 | 1.605 |
 Switzerland Switzerland |
809,466 | 95.31 | 141,863 | 5.706 |
 Norway Norway |
785,000 | 147.769 | 283,606 | 2.768 |
 Honduras Honduras |
773,845.23 | 85.866 | 410,005 | 1.887 |
 Albania Albania |
701,314.38 | 244.333 | 135,654 | 5.17 |
 Slovenia Slovenia |
666,890 | 322.655 | 106,070 | 6.287 |
 Panama Panama |
597,032.22 | 143.559 | 155,285 | 3.845 |
 Mauritania Mauritania |
565,667.04 | 141.976 | 287,398 | 1.968 |
 Tunisia Tunisia |
541,987.78 | 47.35 | 470,329 | 1.152 |
 Macedonia Macedonia |
522,971.56 | 251.998 | 153,454 | 3.408 |
 Mongolia Mongolia |
470,337.11 | 145.883 | 363,061 | 1.295 |
 Yemen Yemen |
435,000 | 15.044 | 543,000 | 0.801 |
 Georgia Georgia |
399,752.4 | 107.184 | 155,638 | 2.568 |
 Haiti Haiti |
330,000 | 29.695 | 310,565 | 1.063 |
 Eritrea Eritrea |
305,240.47 | 58.836 | 477,686 | 0.639 |
 Central African Republic Central African Republic |
302,591.56 | 63.873 | 344,610 | 0.878 |
 Guinea-Bissau Guinea-Bissau |
299,071 | 188.717 | 189,052 | 1.582 |
 Cuba Cuba |
294,460.89 | 26.242 | 142,254 | 2.07 |
 Armenia Armenia |
287,928.5 | 96.952 | 121,528 | 2.369 |
 Liberia Liberia |
256,200 | 58.461 | 240,000 | 1.067 |
 Israel Israel |
232,342.59 | 26.083 | 91,082 | 2.551 |
 Libya Libya |
207,965.31 | 32.138 | 309,742 | 0.671 |
 Suriname Suriname |
203,185.3 | 357.531 | 49,813 | 4.079 |
 Somalia Somalia |
178,060.22 | 11.728 | 353,642 | 0.504 |
 East Timor East Timor |
168,000 | 133.185 | 78,894 | 2.129 |
 Belize Belize |
160,169 | 404.588 | 41,522 | 3.857 |
 Namibia Namibia |
153,012 | 63.395 | 339,089 | 0.451 |
 Luxembourg Luxembourg |
148,070 | 245.961 | 26,730 | 5.539 |
 Lesotho Lesotho |
143,079.9 | 63.225 | 177,933 | 0.804 |
 Lebanon Lebanon |
133,417.54 | 21.895 | 55,239 | 2.415 |
 Oman Oman |
130,076.72 | 25.958 | 7,902 | 16.461 |
 Gambia Gambia |
128,972.23 | 62.871 | 161,065 | 0.801 |
 Swaziland Swaziland |
87,172.99 | 75.198 | 71,001 | 1.228 |
 Costa Rica Costa Rica |
83,440 | 16.677 | 18,758 | 4.448 |
 Botswana Botswana |
74,406.68 | 32.31 | 158,690 | 0.469 |
 Jordan Jordan |
72,666 | 7.102 | 45,557 | 1.595 |
 Bhutan Bhutan |
70,007.72 | 96.278 | 20,211 | 3.464 |
 Palestinian Territories Palestinian Territories |
51,014.38 | 11.212 | 20,698 | 2.465 |
 Cyprus Cyprus |
50,990 | 59.651 | 23,600 | 2.161 |
 Gabon Gabon |
48,106.98 | 23.268 | 30,318 | 1.587 |
 Kuwait Kuwait |
30,954.56 | 7.323 | 2,070 | 14.954 |
 Congo-Brazzaville Congo-Brazzaville |
30,358.59 | 5.622 | 34,588 | 0.878 |
 United Arab Emirates United Arab Emirates |
22,013.6 | 2.307 | 945 | 23.295 |
 Comoros Comoros |
19,705.44 | 23.164 | 11,361 | 1.734 |
 Papua New Guinea Papua New Guinea |
18,719.75 | 2.187 | 3,910 | 4.788 |
 Fiji Fiji |
9,194.18 | 10.39 | 2,237 | 4.11 |
 Iceland Iceland |
7,679 | 21.749 | 3,160 | 2.43 |
 Montenegro Montenegro |
6,846.06 | 11 | 2,065 | 3.315 |
 Trinidad and Tobago Trinidad and Tobago |
5,326 | 3.926 | 3,328 | 1.6 |
 Brunei Brunei |
3,700 | 8.754 | 1,500 | 2.467 |
 Solomon Islands Solomon Islands |
2,752.61 | 4.127 | 1,448 | 1.901 |
 Jamaica Jamaica |
2,291 | 0.84 | 2,009 | 1.14 |
 Qatar Qatar |
2,209.4 | 0.902 | 121 | 18.26 |
 Mauritius Mauritius |
1,502 | 1.187 | 129 | 11.643 |
 Vanuatu Vanuatu |
983.1 | 3.229 | 1,553 | 0.633 |
 São Tomé and Príncipe São Tomé and Príncipe |
786.98 | 3.981 | 393 | 2.002 |
 Saint Vincent and the Grenadines Saint Vincent and the Grenadines |
633 | 5.778 | 45 | 14.067 |
 The Bahamas The Bahamas |
616.45 | 1.617 | 82 | 7.518 |
 Cape Verde Cape Verde |
464 | 0.853 | 20,190 | 0.023 |
 Grenada Grenada |
389.98 | 3.774 | 390 | 1 |
 Federated States of Micronesia Federated States of Micronesia |
289.36 | 2.748 | 170 | 1.702 |
 Maldives Maldives |
205.35 | 0.543 | 84 | 2.445 |
 Dominica Dominica |
193.13 | 2.709 | 115 | 1.679 |
 Antigua and Barbuda Antigua and Barbuda |
46.25 | 0.536 | 22 | 2.102 |
 Barbados Barbados |
41.66 | 0.145 | 15 | 2.777 |
 Djibouti Djibouti |
17.33 | 0.017 | 9 | 1.926 |
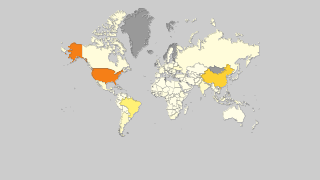
Top Total Cereal Producing Countries by Share
- China accounts for over 20% of the global production, a significant share that emphasizes its agricultural dominance.
- The United States of America contributes nearly 15% to the world's Total Cereal, reflecting its extensive cereal farming industry.
- India's share of almost 12% underscores its essential contribution to global cereal supplies.
- Brazil holds about 5% of the global share, a testament to its expanding agricultural sector.
- Collectively, these top producers account for nearly half of the global Total Cereal production, highlighting their pivotal roles.