Countries by Barley production
Barley is a key cereal crop used for fodder, food, and brewing purposes. It thrives in climates with moderate temperature and good rainfall and is predominantly grown in temperate regions. This data for the year 2023, sourced from the Food and Agriculture Organization (FAO) stats database, provides insights into the importance of barley as a staple in global agriculture.
Global Barley Production
In 2023, the global production of barley was approximately 146 million tonnes. Over the decades, barley production has shown fluctuations, with significant growth from the 1960s through to the late 20th century. While there have been periods of decrease, overall, the trend has been upward from around 72 million tonnes in 1961 to around 146 million tonnes in 2023, highlighting the growing importance and demand for barley worldwide.
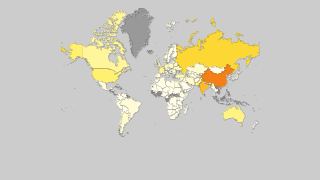
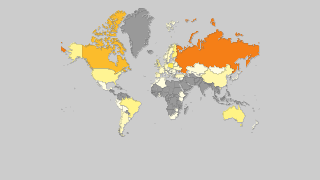
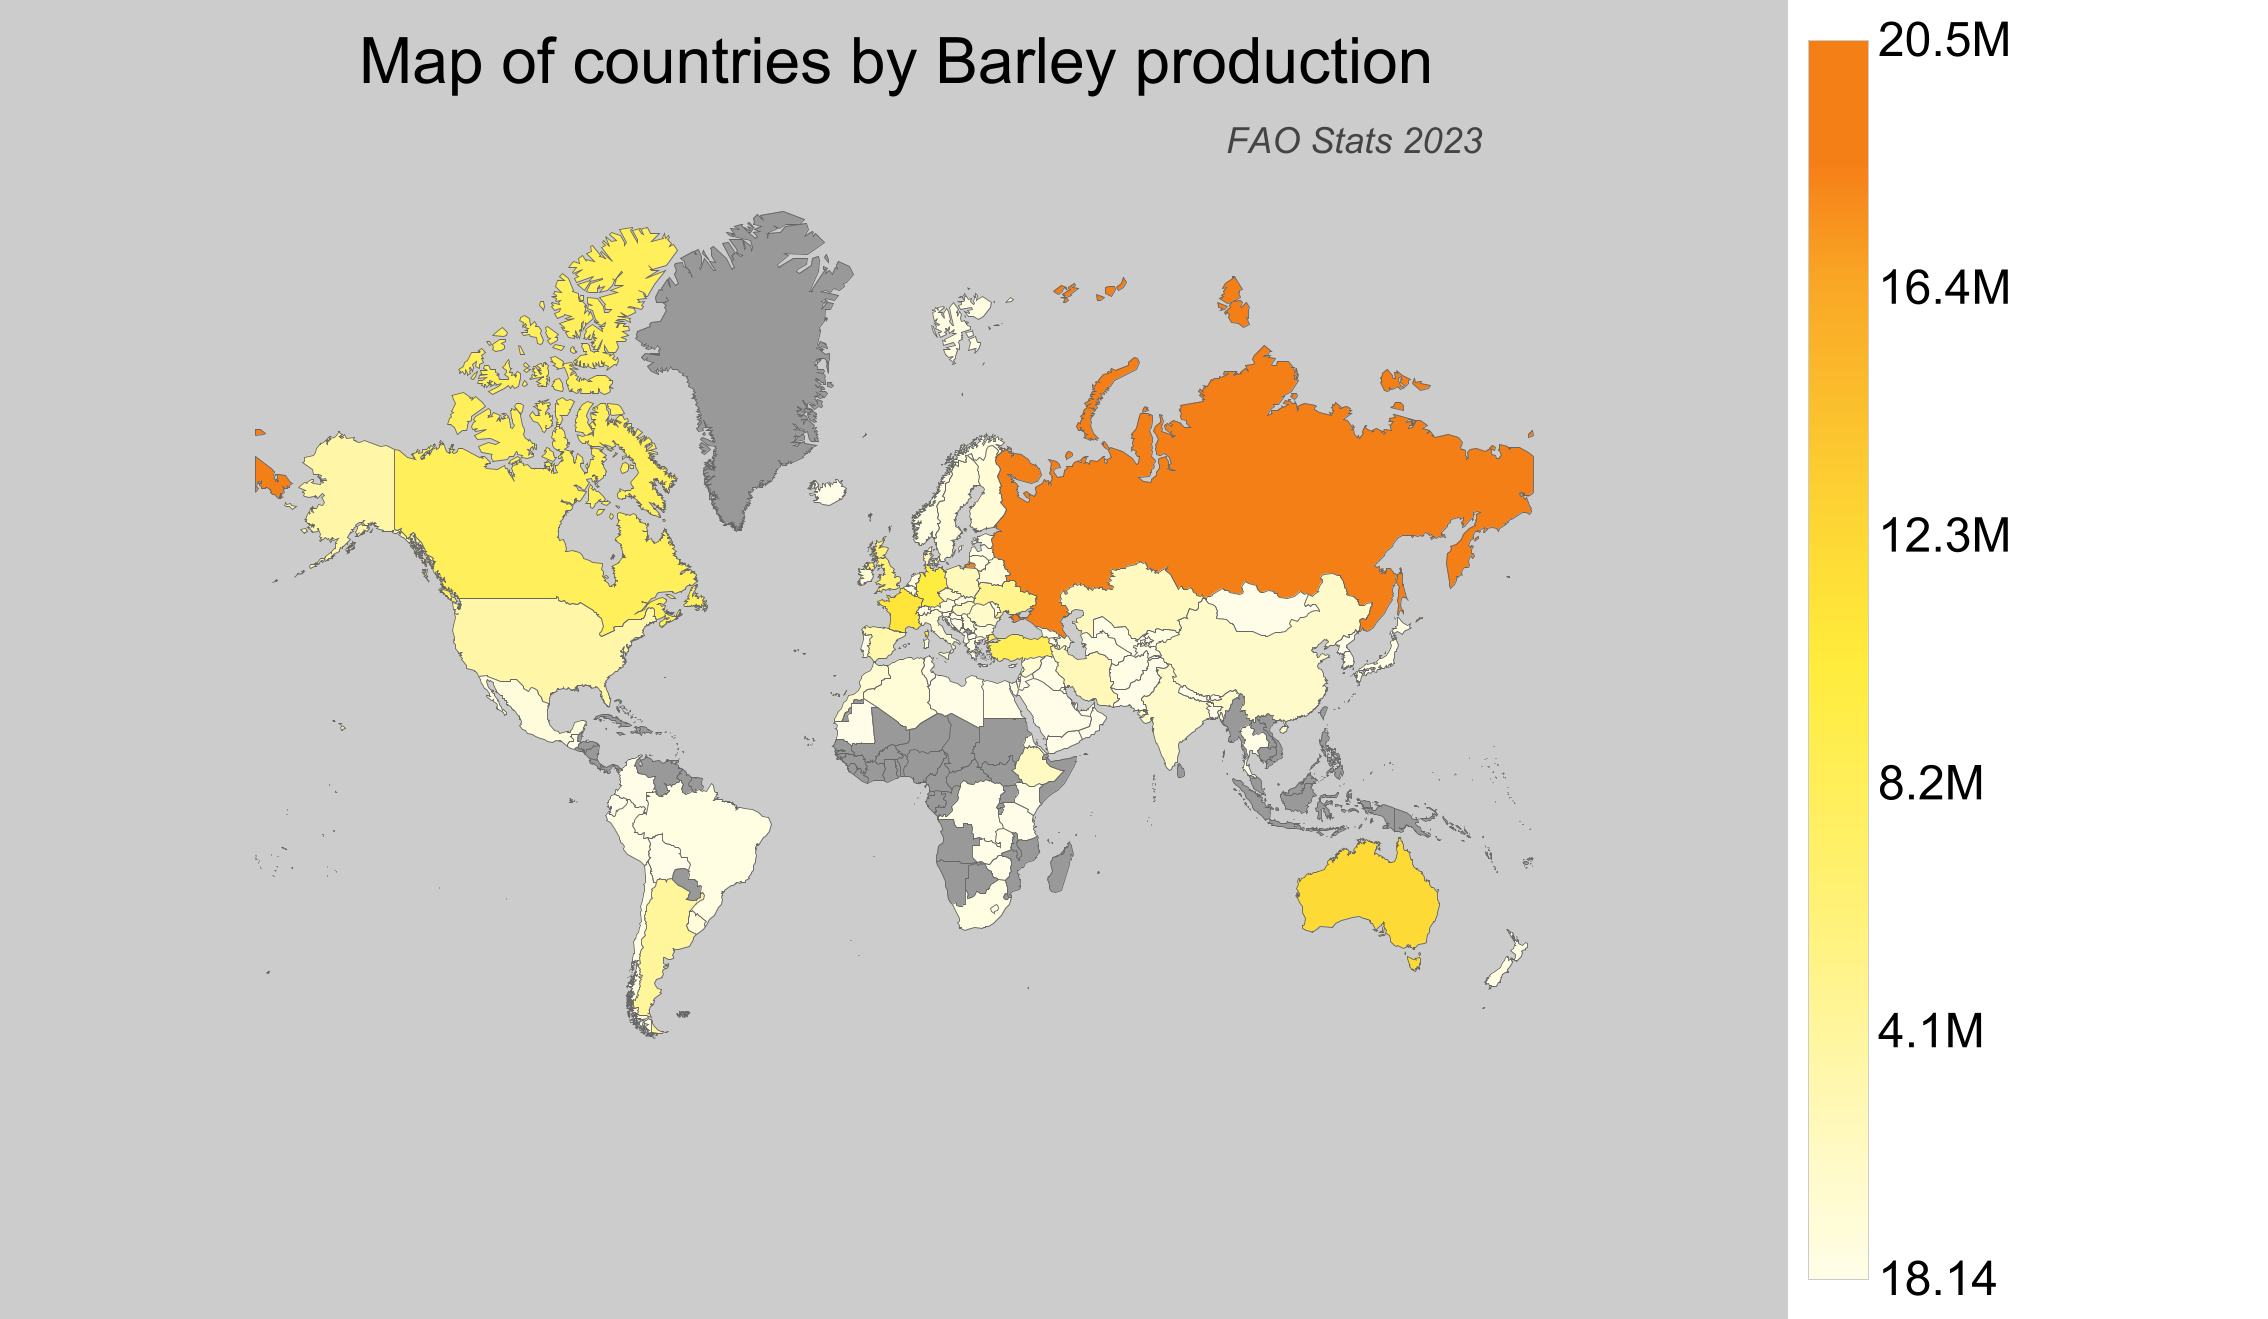
Barley Production by Country
- The Russian Federation leads the world in barley production, producing around 20.5 million tonnes.
- Australia follows with approximately 13.5 million tonnes, making it a major contributor to the global barley market.
- France produces about 12.1 million tonnes, showcasing its role as a key player in barley agriculture.
- Germany contributes around 11 million tonnes, emphasizing its significant role in European barley production.
- Canada, although not one of the top four, is a notable producer with approximately 8.9 million tonnes of barley.
| Country | Production (tonnes) | Production per Person (kg) | Harvested Area (ha) | Yield (kg/ha) |
|---|---|---|---|---|
 Russian Federation Russian Federation |
20,500,000 | 139.572 | 7,650,000 | 2.68 |
 Australia Australia |
13,491,375 | 538.591 | 3,807,695 | 3.543 |
 France France |
12,143,490 | 180.446 | 1,815,490 | 6.689 |
 Germany Germany |
10,999,900 | 132.944 | 1,612,200 | 6.823 |
 Turkey Turkey |
9,200,000 | 107.763 | 3,278,176 | 2.806 |
 Canada Canada |
8,896,244 | 239.059 | 2,699,000 | 3.296 |
 United Kingdom United Kingdom |
6,963,000 | 105.436 | 1,137,000 | 6.124 |
 Ukraine Ukraine |
5,507,190 | 130.305 | 1,494,300 | 3.685 |
 Argentina Argentina |
4,695,914 | 105.539 | 1,589,966 | 2.953 |
 United States of America United States of America |
4,028,680 | 12.291 | 1,033,980 | 3.896 |
 Spain Spain |
3,757,570 | 80.532 | 2,342,260 | 1.604 |
 Iran Iran |
3,000,000 | 36.694 | 1,650,000 | 1.818 |
 Poland Poland |
2,850,870 | 74.177 | 647,510 | 4.403 |
 Kazakhstan Kazakhstan |
2,613,882 | 143.051 | 2,424,652 | 1.078 |
 Denmark Denmark |
2,541,600 | 438.967 | 561,000 | 4.53 |
 Ethiopia Ethiopia |
2,450,000 | 22.783 | 980,000 | 2.5 |
 Hungary Hungary |
2,219,720 | 227.174 | 412,920 | 5.376 |
 China China |
2,000,000 | 1.435 | 510,000 | 3.922 |
 Romania Romania |
1,997,620 | 102.316 | 497,770 | 4.013 |
 India India |
1,912,919.44 | 1.431 | 628,325 | 3.044 |
 Czech Republic Czech Republic |
1,764,210 | 166.226 | 321,130 | 5.494 |
 Morocco Morocco |
1,348,114.49 | 38.767 | 1,239,809 | 1.087 |
 Syria Syria |
1,226,399 | 67.073 | 1,266,567 | 0.968 |
 Ireland Ireland |
1,214,720 | 250.097 | 186,340 | 6.519 |
 Italy Italy |
1,193,930 | 19.755 | 290,300 | 4.113 |
 Belarus Belarus |
1,150,000 | 121.331 | 280,951 | 4.093 |
 Finland Finland |
1,078,700 | 195.491 | 340,700 | 3.166 |
 Azerbaijan Azerbaijan |
1,039,018.6 | 104.972 | 356,540 | 2.914 |
 Algeria Algeria |
1,000,000 | 23.504 | 1,025,000 | 0.976 |
 Uruguay Uruguay |
897,200 | 255.905 | 211,000 | 4.252 |
 Sweden Sweden |
855,500 | 84.107 | 259,700 | 3.294 |
 Mexico Mexico |
832,037.28 | 6.67 | 297,445 | 2.797 |
 Bulgaria Bulgaria |
797,220 | 113.08 | 149,980 | 5.316 |
 Austria Austria |
772,120 | 87.362 | 122,710 | 6.292 |
 Slovakia Slovakia |
603,020 | 110.786 | 114,190 | 5.281 |
 Lithuania Lithuania |
566,880 | 202.404 | 159,430 | 3.556 |
 Serbia Serbia |
538,215 | 76.872 | 108,839 | 4.945 |
 Norway Norway |
405,000 | 76.238 | 141,922 | 2.854 |
 Belgium Belgium |
393,780 | 34.491 | 48,860 | 8.059 |
 Kyrgyzstan Kyrgyzstan |
382,085 | 60.559 | 241,213 | 1.584 |
 South Africa South Africa |
377,000 | 6.531 | 107,600 | 3.504 |
 Brazil Brazil |
375,423 | 1.792 | 131,981 | 2.845 |
 Greece Greece |
362,520 | 33.666 | 130,780 | 2.772 |
 New Zealand New Zealand |
357,882 | 73.02 | 50,054 | 7.15 |
 Estonia Estonia |
331,690 | 251.445 | 112,330 | 2.953 |
 Croatia Croatia |
293,410 | 69.991 | 72,630 | 4.04 |
 Turkmenistan Turkmenistan |
277,644.8 | 47.449 | 139,647 | 1.988 |
 Moldova Moldova |
242,927 | 68.413 | 60,075 | 4.044 |
 Latvia Latvia |
232,900 | 120.943 | 83,600 | 2.786 |
 Japan Japan |
232,300 | 1.837 | 64,000 | 3.63 |
 The Netherlands The Netherlands |
230,510 | 13.362 | 35,340 | 6.523 |
 Peru Peru |
211,199.92 | 6.761 | 109,111 | 1.936 |
 Thailand Thailand |
182,266.25 | 2.635 | 74,648 | 2.442 |
 Tajikistan Tajikistan |
169,900 | 19.024 | 72,300 | 2.35 |
 Switzerland Switzerland |
164,594 | 19.38 | 26,819 | 6.137 |
 Uzbekistan Uzbekistan |
163,689.5 | 5.013 | 102,792 | 1.592 |
 Chile Chile |
151,455.69 | 8.618 | 21,586 | 7.016 |
 Macedonia Macedonia |
145,019 | 69.879 | 45,580 | 3.182 |
 Afghanistan Afghanistan |
110,000 | 3.484 | 80,000 | 1.375 |
 Iraq Iraq |
105,903 | 2.692 | 63,674 | 1.663 |
 Slovenia Slovenia |
101,050 | 48.89 | 21,950 | 4.604 |
 Egypt Egypt |
90,000 | 0.923 | 22,000 | 4.091 |
 Tunisia Tunisia |
89,000 | 7.775 | 108,000 | 0.824 |
 Armenia Armenia |
83,648.5 | 28.166 | 39,848 | 2.099 |
 Bosnia and Herzegovina Bosnia and Herzegovina |
75,561 | 19.966 | 20,312 | 3.72 |
 Libya Libya |
68,000 | 10.508 | 132,446 | 0.513 |
 South Korea South Korea |
66,094 | 1.28 | 25,250 | 2.618 |
 Eritrea Eritrea |
65,000 | 12.529 | 45,000 | 1.444 |
 Zimbabwe Zimbabwe |
58,261.68 | 3.924 | 10,635 | 5.478 |
 Georgia Georgia |
52,900 | 14.184 | 24,500 | 2.159 |
 Bolivia Bolivia |
47,484.65 | 4.199 | 53,738 | 0.884 |
 Jordan Jordan |
44,497 | 4.349 | 33,375 | 1.333 |
 Pakistan Pakistan |
43,485 | 0.215 | 40,563 | 1.072 |
 North Korea North Korea |
41,552.08 | 1.622 | 34,117 | 1.218 |
 Kenya Kenya |
32,876 | 0.645 | 13,292 | 2.473 |
 Luxembourg Luxembourg |
30,980 | 51.461 | 5,760 | 5.378 |
 Lebanon Lebanon |
30,000 | 4.923 | 14,000 | 2.143 |
 Yemen Yemen |
30,000 | 1.038 | 28,000 | 1.071 |
 Portugal Portugal |
26,330 | 2.559 | 13,780 | 1.911 |
 Nepal Nepal |
25,911.81 | 0.887 | 17,536 | 1.478 |
 Cyprus Cyprus |
21,490 | 25.14 | 10,000 | 2.149 |
 Albania Albania |
21,178.8 | 7.379 | 6,260 | 3.383 |
 Palestinian Territories Palestinian Territories |
14,435.9 | 3.173 | 6,119 | 2.359 |
 Israel Israel |
11,200 | 1.257 | 6,000 | 1.867 |
 Colombia Colombia |
10,218 | 0.205 | 3,420 | 2.988 |
 Ecuador Ecuador |
8,518.83 | 0.499 | 5,920 | 1.439 |
 Iceland Iceland |
7,679 | 21.749 | 3,160 | 2.43 |
 Mongolia Mongolia |
6,517.67 | 2.022 | 4,982 | 1.308 |
 Kuwait Kuwait |
4,709.27 | 1.114 | 624 | 7.547 |
 Tanzania Tanzania |
3,787 | 0.07 | 1,984 | 1.909 |
 Zambia Zambia |
3,519.41 | 0.208 | 448 | 7.856 |
 Oman Oman |
2,188 | 0.437 | 961 | 2.277 |
 Saudi Arabia Saudi Arabia |
2,000 | 0.06 | 300 | 6.667 |
 Mauritania Mauritania |
1,467.04 | 0.368 | 483 | 3.037 |
 Congo-Kinshasa Congo-Kinshasa |
993.57 | 0.012 | 1,458 | 0.681 |
 Montenegro Montenegro |
940.18 | 1.511 | 343 | 2.741 |
 Bhutan Bhutan |
518.13 | 0.713 | 463 | 1.119 |
 Lesotho Lesotho |
298.86 | 0.132 | 841 | 0.355 |
 Qatar Qatar |
193 | 0.079 | 24 | 8.042 |
 Bangladesh Bangladesh |
159 | 0.001 | 169 | 0.941 |
 United Arab Emirates United Arab Emirates |
110 | 0.012 | 14 | 7.857 |
 Guatemala Guatemala |
18.14 | 0.001 | 8 | 2.268 |
Top Barley Producing Countries by Share
- The Russian Federation accounts for over 14% of the world's barley production, highlighting its dominant position.
- Australia provides around 9.3% of global barley, emphasizing its sizeable contribution.
- France's share stands at approximately 8.3%, showcasing its influence in the barley market.
- Germany holds about 7.5%, marking its substantial part in the European and global production.
- Canada contributes over 6%, ensuring its place as a significant player despite being ranked 6th globally.