Countries by Rice production
Rice is a staple food for billions worldwide, thriving in warm, humid climates found predominantly in Asian regions. Known for its adaptability, Rice serves as a primary dietary component in many parts of the world. The data presented here is for the year 2023, the most recent year available according to the Food and Agriculture Organization (FAO) statistics database as of 2025.
Global Rice Production
In 2023, global Rice production reached approximately 800 million tonnes. Over the past decades, production has shown a significant upward trend, growing from around 216 million tonnes in 1961 to today's numbers. This illustrates a sustained growth pattern, underscoring the increasing demand and optimization of Rice farming practices worldwide.
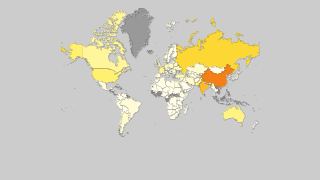
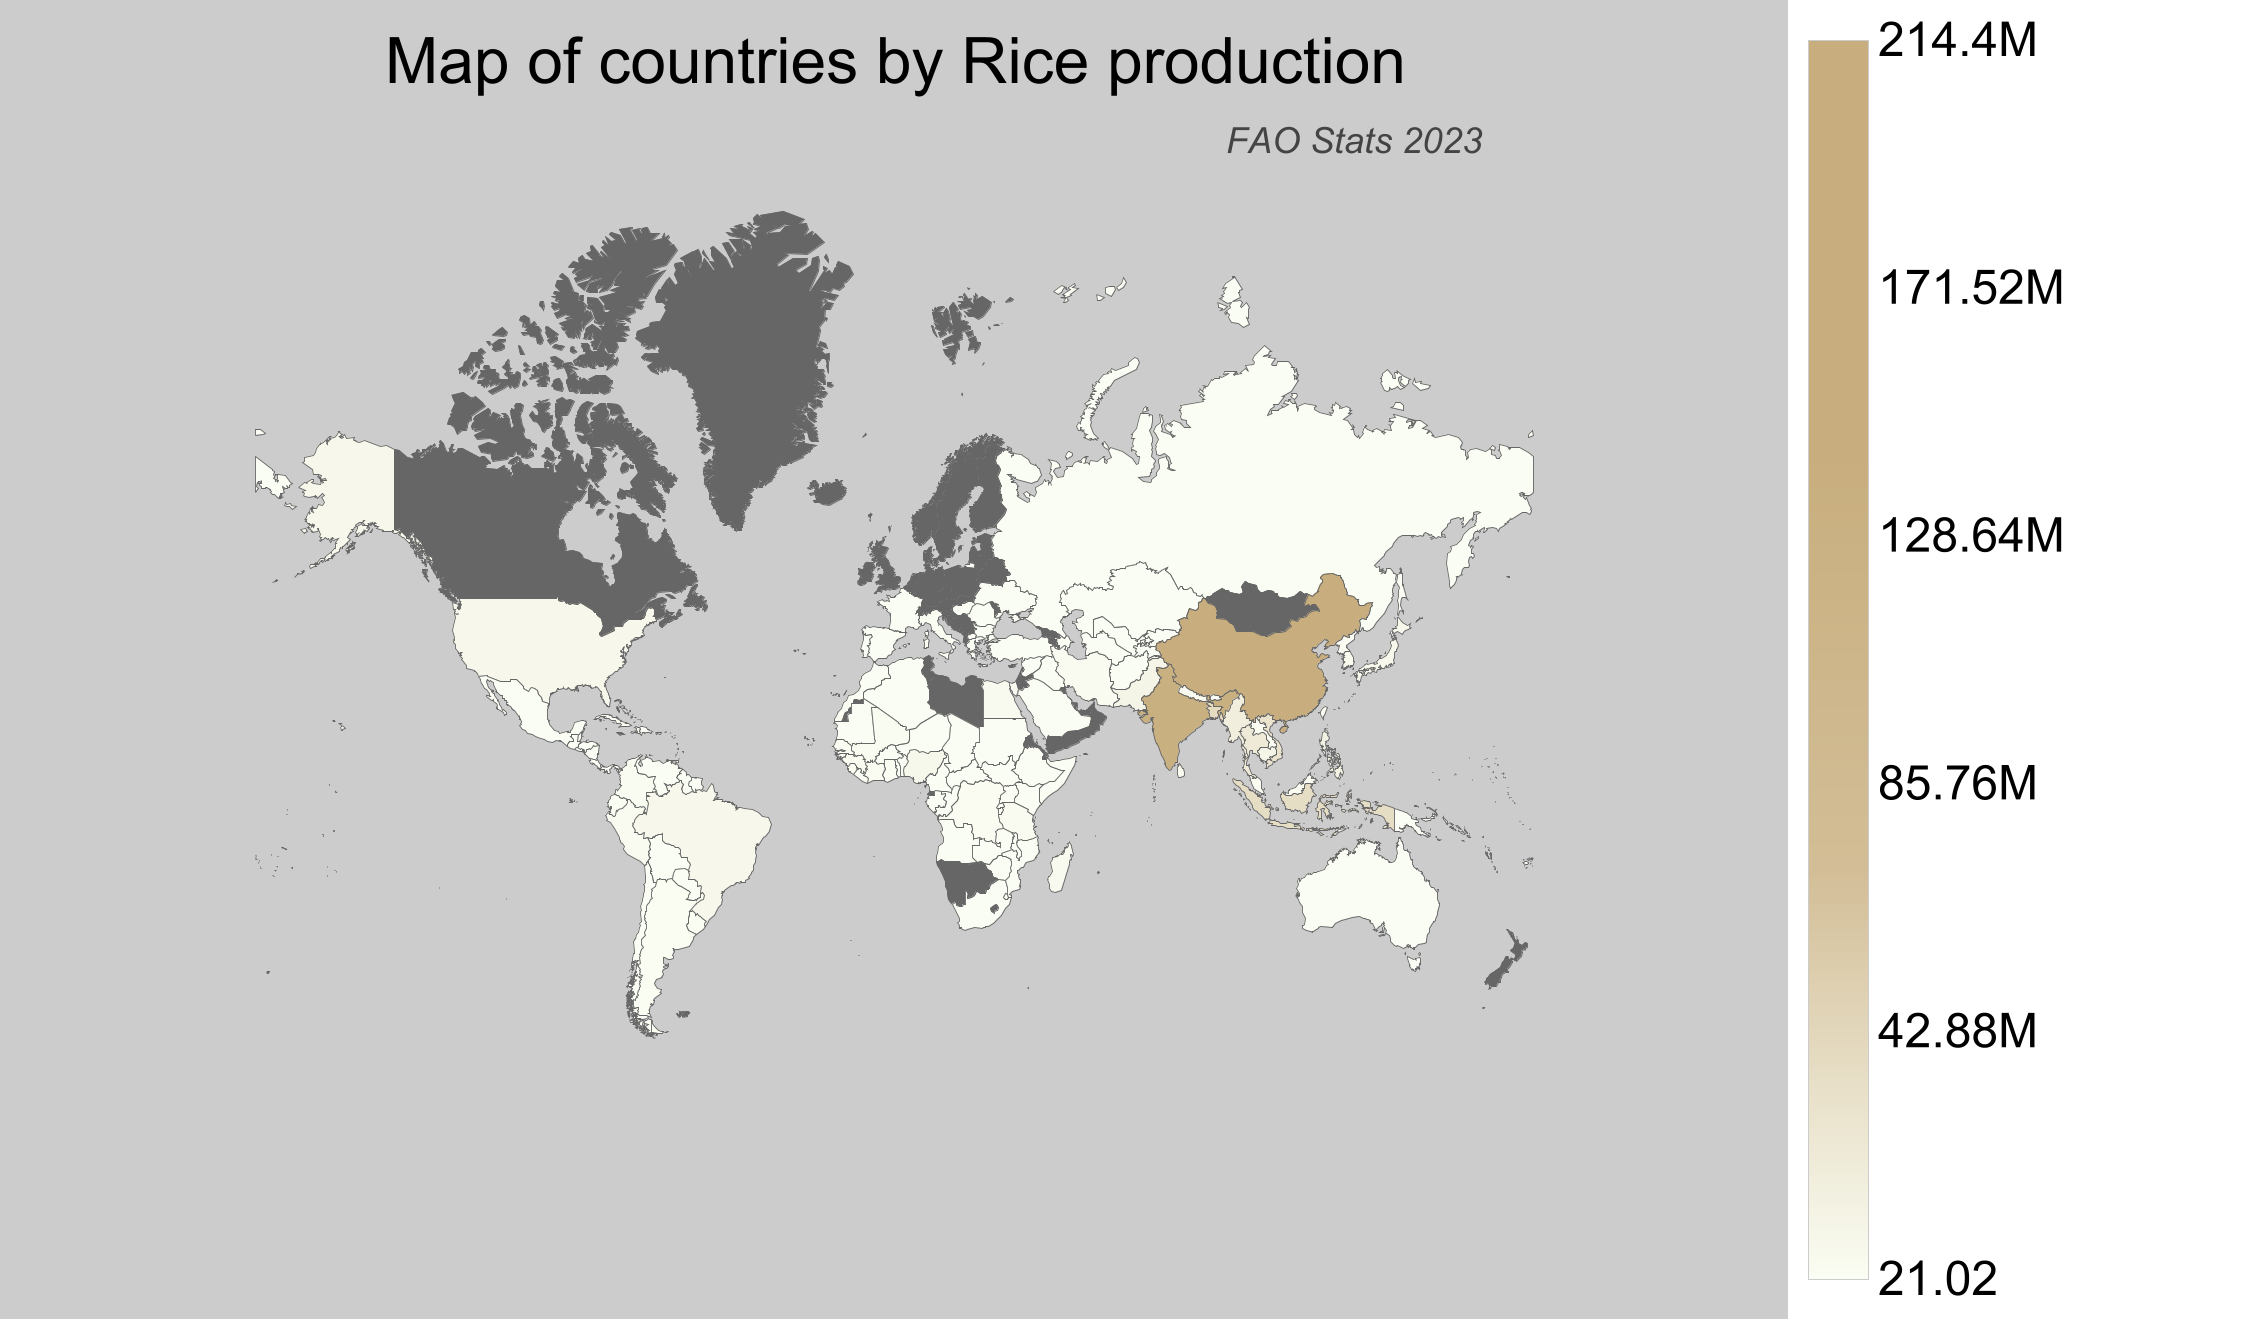
Rice Production by Country
- China produced around 214 million tonnes of Rice, leading the global production.
- India was the second-largest producer with approximately 207 million tonnes.
- Bangladesh contributed around 59 million tonnes, maintaining its position among the top producers.
- Indonesia produced about 54 million tonnes, solidifying its stance as a significant player in Rice production.
- Canada is not listed by FAO as a Rice producer, highlighting its non-involvement in Rice farming.
| Country | Production (tonnes) | Production per Person (kg) | Harvested Area (ha) | Yield (kg/ha) |
|---|---|---|---|---|
 China China |
214,403,870.05 | 153.82 | 30,145,222 | 7.112 |
 India India |
206,727,000 | 154.68 | 47,828,000 | 4.322 |
 Bangladesh Bangladesh |
58,613,458 | 354.962 | 11,641,645 | 5.035 |
 Indonesia Indonesia |
53,980,993 | 203.69 | 10,213,705 | 5.285 |
 Vietnam Vietnam |
43,497,624.81 | 459.514 | 7,115,058 | 6.113 |
 Thailand Thailand |
33,070,957 | 478.02 | 11,189,393 | 2.956 |
 Myanmar Myanmar |
25,650,000 | 476.211 | 6,463,645 | 3.968 |
 Philippines Philippines |
20,059,561.96 | 188.514 | 4,815,813 | 4.165 |
 Pakistan Pakistan |
14,803,800 | 73.333 | 3,636,994 | 4.07 |
 Cambodia Cambodia |
12,900,000 | 802.742 | 3,600,387 | 3.583 |
 Brazil Brazil |
10,285,663 | 49.089 | 1,482,748 | 6.937 |
 Japan Japan |
10,136,000 | 80.133 | 1,478,300 | 6.857 |
 United States of America United States of America |
9,901,510 | 30.209 | 1,154,990 | 8.573 |
 Nigeria Nigeria |
8,902,200 | 45.098 | 4,509,800 | 1.974 |
 Nepal Nepal |
5,724,200 | 195.908 | 1,439,000 | 3.978 |
 Egypt Egypt |
5,600,000 | 57.438 | 642,501 | 8.716 |
 Madagascar Madagascar |
5,117,636 | 194.862 | 2,070,335 | 2.472 |
 South Korea South Korea |
4,897,839 | 94.855 | 708,012 | 6.918 |
 Sri Lanka Sri Lanka |
4,513,431 | 210.475 | 1,162,805 | 3.882 |
 Laos Laos |
3,835,000 | 550.91 | 876,190 | 4.377 |
 Iran Iran |
3,598,594.46 | 44.016 | 749,746 | 4.8 |
 Tanzania Tanzania |
3,588,000 | 66.2 | 1,200,000 | 2.99 |
 Guinea Guinea |
3,534,800 | 297.454 | 2,352,000 | 1.503 |
 Peru Peru |
3,367,614.31 | 107.807 | 417,103 | 8.074 |
 Mali Mali |
3,023,891 | 158.255 | 906,982 | 3.334 |
 Colombia Colombia |
3,006,100 | 60.207 | 667,500 | 4.504 |
 Malaysia Malaysia |
2,166,738 | 66.351 | 614,839 | 3.524 |
 Côte d'Ivoire Côte d'Ivoire |
2,011,500 | 80.764 | 684,861 | 2.937 |
 Congo-Kinshasa Congo-Kinshasa |
1,812,345 | 22.281 | 1,906,250 | 0.951 |
 North Korea North Korea |
1,775,787.84 | 69.338 | 386,291 | 4.597 |
 Taiwan Taiwan |
1,560,870 | 66.204 | 224,022 | 6.967 |
 Senegal Senegal |
1,519,700 | 96.636 | 398,367 | 3.815 |
 Ghana Ghana |
1,463,000 | 49.402 | 370,000 | 3.954 |
 Sierra Leone Sierra Leone |
1,399,500 | 181.289 | 918,325 | 1.524 |
 Italy Italy |
1,378,640 | 22.811 | 210,240 | 6.557 |
 Uruguay Uruguay |
1,372,700 | 391.53 | 147,000 | 9.338 |
 Ecuador Ecuador |
1,313,000 | 76.934 | 343,050 | 3.827 |
 Argentina Argentina |
1,163,209 | 26.143 | 173,002 | 6.724 |
 Russian Federation Russian Federation |
1,065,700 | 7.256 | 185,400 | 5.748 |
 Guyana Guyana |
995,000 | 1,272.013 | 162,801 | 6.112 |
 Paraguay Paraguay |
978,450 | 138.729 | 170,100 | 5.752 |
 Dominican Republic Dominican Republic |
947,005 | 92.245 | 187,527 | 5.05 |
 Turkey Turkey |
900,000 | 10.542 | 112,120 | 8.027 |
 Venezuela Venezuela |
722,370.07 | 22.696 | 192,541 | 3.752 |
 Bolivia Bolivia |
698,543.58 | 61.778 | 208,226 | 3.355 |
 Afghanistan Afghanistan |
597,000 | 18.907 | 129,000 | 4.628 |
 Burkina Faso Burkina Faso |
504,254 | 24.909 | 212,294 | 2.375 |
 Nicaragua Nicaragua |
498,969.09 | 79.394 | 82,840 | 6.023 |
 Australia Australia |
496,633 | 19.826 | 52,188 | 9.516 |
 Benin Benin |
492,626.2 | 43.356 | 132,046 | 3.731 |
 Kazakhstan Kazakhstan |
485,183 | 26.553 | 100,008 | 4.851 |
 Mauritania Mauritania |
458,200 | 115.003 | 86,000 | 5.328 |
 Panama Panama |
436,135 | 104.871 | 101,370 | 4.302 |
 Burundi Burundi |
412,369.01 | 38.607 | 210,518 | 1.959 |
 Cameroon Cameroon |
358,432.99 | 15.064 | 156,555 | 2.29 |
 Uzbekistan Uzbekistan |
355,674.49 | 10.892 | 42,250 | 8.418 |
 Spain Spain |
334,100 | 7.16 | 55,120 | 6.061 |
 Uganda Uganda |
260,000 | 6.697 | 200,000 | 1.3 |
 Liberia Liberia |
256,200 | 58.461 | 240,000 | 1.067 |
 Mexico Mexico |
252,099.88 | 2.021 | 36,693 | 6.871 |
 Kenya Kenya |
229,064 | 4.496 | 38,939 | 5.883 |
 Guinea-Bissau Guinea-Bissau |
226,400 | 142.86 | 120,000 | 1.887 |
 Chad Chad |
223,952 | 14.587 | 175,489 | 1.276 |
 Suriname Suriname |
203,155.93 | 357.479 | 49,808 | 4.079 |
 Ethiopia Ethiopia |
202,000 | 1.878 | 60,000 | 3.367 |
 Greece Greece |
190,440 | 17.685 | 27,600 | 6.9 |
 Togo Togo |
183,100 | 24.905 | 113,825 | 1.609 |
 Portugal Portugal |
178,830 | 17.377 | 27,940 | 6.401 |
 Mozambique Mozambique |
161,920 | 5.61 | 365,796 | 0.443 |
 Niger Niger |
142,600 | 6.643 | 30,000 | 4.753 |
 Haiti Haiti |
136,000 | 12.238 | 52,336 | 2.599 |
 Tajikistan Tajikistan |
134,484.66 | 15.058 | 13,620 | 9.874 |
 Rwanda Rwanda |
133,628.01 | 11.135 | 32,673 | 4.09 |
 Cuba Cuba |
130,000 | 11.585 | 44,420 | 2.927 |
 Malawi Malawi |
124,300 | 6.932 | 79,100 | 1.571 |
 Chile Chile |
109,232.5 | 6.216 | 17,945 | 6.087 |
 Turkmenistan Turkmenistan |
86,616.7 | 14.803 | 19,571 | 4.426 |
 East Timor East Timor |
83,000 | 65.8 | 38,418 | 2.16 |
 Costa Rica Costa Rica |
76,119 | 15.213 | 14,835 | 5.131 |
 France France |
68,270 | 1.014 | 12,120 | 5.633 |
 Bulgaria Bulgaria |
64,160 | 9.101 | 11,200 | 5.729 |
 Zambia Zambia |
62,679.81 | 3.712 | 49,414 | 1.268 |
 Morocco Morocco |
56,222 | 1.617 | 7,027 | 8.001 |
 Gambia Gambia |
55,100 | 26.86 | 65,000 | 0.848 |
 Central African Republic Central African Republic |
53,326 | 11.256 | 38,090 | 1.4 |
 Guatemala Guatemala |
51,193 | 2.959 | 14,469 | 3.538 |
 Kyrgyzstan Kyrgyzstan |
46,765 | 7.412 | 11,787 | 3.968 |
 Bhutan Bhutan |
40,804.01 | 56.115 | 9,425 | 4.329 |
 Angola Angola |
39,830 | 1.362 | 33,983 | 1.172 |
 Honduras Honduras |
34,869.78 | 3.869 | 11,315 | 3.082 |
 South Sudan South Sudan |
33,000 | 2.678 | 30,269 | 1.09 |
 Sudan Sudan |
21,880 | 0.536 | 4,982 | 4.392 |
 Macedonia Macedonia |
19,997 | 9.636 | 3,162 | 6.324 |
 Belize Belize |
17,701 | 44.713 | 3,159 | 5.603 |
 Azerbaijan Azerbaijan |
13,972.5 | 1.412 | 3,004 | 4.651 |
 Iraq Iraq |
12,602 | 0.32 | 3,472 | 3.63 |
 Romania Romania |
12,070 | 0.618 | 2,430 | 4.967 |
 Ukraine Ukraine |
11,080 | 0.262 | 2,200 | 5.036 |
 El Salvador El Salvador |
11,000 | 1.656 | 1,593 | 6.905 |
 Hungary Hungary |
8,330 | 0.853 | 2,340 | 3.56 |
 Fiji Fiji |
7,165.4 | 8.098 | 1,894 | 3.783 |
 Brunei Brunei |
3,700 | 8.754 | 1,500 | 2.467 |
 South Africa South Africa |
3,082.07 | 0.053 | 1,065 | 2.894 |
 Solomon Islands Solomon Islands |
2,752.61 | 4.127 | 1,448 | 1.901 |
 Somalia Somalia |
2,000 | 0.132 | 1,000 | 2 |
 Gabon Gabon |
1,731.31 | 0.837 | 640 | 2.705 |
 Swaziland Swaziland |
1,000.63 | 0.863 | 321 | 3.117 |
 Congo-Brazzaville Congo-Brazzaville |
1,000 | 0.185 | 1,735 | 0.576 |
 Papua New Guinea Papua New Guinea |
885.01 | 0.103 | 411 | 2.153 |
 Saudi Arabia Saudi Arabia |
816.48 | 0.024 | 336 | 2.43 |
 Trinidad and Tobago Trinidad and Tobago |
326 | 0.24 | 328 | 0.994 |
 Algeria Algeria |
307.29 | 0.007 | 172 | 1.787 |
 Federated States of Micronesia Federated States of Micronesia |
181.54 | 1.724 | 99 | 1.834 |
 Syria Syria |
100 | 0.005 | 20 | 5 |
 Zimbabwe Zimbabwe |
73.5 | 0.005 | 224 | 0.328 |
 Comoros Comoros |
21.02 | 0.025 | 70 | 0.3 |
Top Rice Producing Countries by Share
- China accounts for about 26.8% of global Rice production, making it the largest single contributor.
- India holds roughly 25.8% of the world's production, following closely behind China.
- Bangladesh, with 7.3% of the global share, ranks as one of the substantial contributors.
- Indonesia's share stands at approximately 6.7%.
- The significant portion of global production dominated by just China and India emphasizes the concentration of Rice farming in Asia.