Countries by Oat production
Oat is a vital cereal grain known for its nutritional value and versatility, grown primarily in temperate regions. As a key component of many diets worldwide, oat flourishes in cooler climates with moderate rainfall. According to the latest available data from the Food and Agriculture Organization (FAO) stats database for the year 2023, oat remains an essential crop for many regions due to its adaptability and health benefits.
Global Oat Production
In 2023, global oat production reached approximately 18.8 million tonnes. Over the years, there has been a general decline in production compared to the early 1960s, when production was around 50 million tonnes. This decrease can be attributed to changing agricultural practices and crop preferences. However, certain countries have maintained or increased their oat output in recent years, reflecting the ongoing demand. Since 1961, there has been a steady decrease in production, with some fluctuations, including a recent rise before 2023, which saw more than 5 million tonnes less production than in 2022.
Oat Production by Country
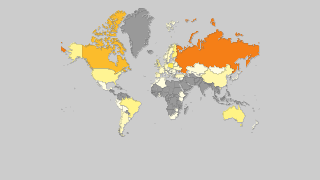
- The Russian Federation leads global oat production with around 3.3 million tonnes, showcasing its agricultural strength in cereal crops.
- Canada contributes significantly with nearly 2.6 million tonnes, demonstrating its prominent role in global cereal production.
- Poland's production stands at approximately 1.5 million tonnes, maintaining its position among the top oat producers.
- Finland continues to be a key player with around 1 million tonnes, benefiting from its favorable climate for oat farming.
| Country | Production (tonnes) | Production per Person (kg) | Harvested Area (ha) | Yield (kg/ha) |
|---|---|---|---|---|
 Russian Federation Russian Federation |
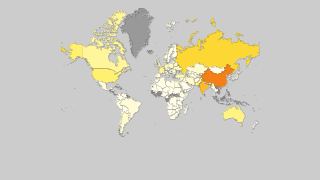
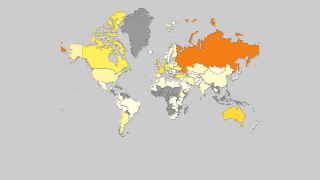
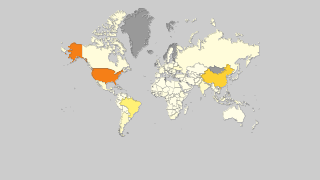
3,300,000 | 22.468 | 1,770,000 | 1.864 |
 Canada Canada |
2,635,574 | 70.823 | 822,500 | 3.204 |
 Poland Poland |
1,503,440 | 39.118 | 497,690 | 3.021 |
 Finland Finland |
1,019,720 | 184.803 | 291,300 | 3.501 |
 Australia Australia |
959,829 | 38.317 | 569,082 | 1.687 |
 Brazil Brazil |
907,046 | 4.329 | 528,649 | 1.716 |
 United Kingdom United Kingdom |
830,000 | 12.568 | 167,000 | 4.97 |
 United States of America United States of America |
828,010 | 2.526 | 336,300 | 2.462 |
 China China |
600,000 | 0.43 | 163,060 | 3.68 |
 Spain Spain |
464,140 | 9.947 | 466,760 | 0.994 |
 Germany Germany |
452,000 | 5.463 | 139,500 | 3.24 |
 Argentina Argentina |
428,884 | 9.639 | 257,361 | 1.666 |
 Ukraine Ukraine |
427,270 | 10.11 | 164,800 | 2.593 |
 Sweden Sweden |
411,500 | 40.456 | 139,460 | 2.951 |
 Turkey Turkey |
410,000 | 4.802 | 138,212 | 2.966 |
 Belarus Belarus |
350,000 | 36.927 | 155,000 | 2.258 |
 France France |
337,340 | 5.013 | 78,900 | 4.276 |
 Chile Chile |
333,069.55 | 18.952 | 71,685 | 4.646 |
 Italy Italy |
231,430 | 3.829 | 102,600 | 2.256 |
 Denmark Denmark |
208,100 | 35.942 | 55,230 | 3.768 |
 Latvia Latvia |
200,300 | 104.014 | 94,700 | 2.115 |
 Lithuania Lithuania |
194,670 | 69.507 | 91,750 | 2.122 |
 Ireland Ireland |
180,910 | 37.247 | 27,230 | 6.644 |
 Norway Norway |
179,000 | 33.695 | 68,449 | 2.615 |
 Romania Romania |
155,200 | 7.949 | 76,590 | 2.026 |
 Kazakhstan Kazakhstan |
149,705.6 | 8.193 | 190,673 | 0.785 |
 Czech Republic Czech Republic |
118,590 | 11.174 | 43,000 | 2.758 |
 Estonia Estonia |
80,690 | 61.169 | 35,720 | 2.259 |
 Algeria Algeria |
76,000 | 1.786 | 80,000 | 0.95 |
 Greece Greece |
69,190 | 6.425 | 61,650 | 1.122 |
 Mexico Mexico |
61,785.28 | 0.495 | 25,465 | 2.426 |
 Hungary Hungary |
60,580 | 6.2 | 22,050 | 2.747 |
 Austria Austria |
60,380 | 6.832 | 17,620 | 3.427 |
 Serbia Serbia |
49,695 | 7.098 | 17,027 | 2.919 |
 Ethiopia Ethiopia |
47,931.12 | 0.446 | 21,760 | 2.203 |
 South Africa South Africa |
41,000 | 0.71 | 27,500 | 1.491 |
 Morocco Morocco |
36,290 | 1.044 | 16,720 | 2.17 |
 Bosnia and Herzegovina Bosnia and Herzegovina |
34,490 | 9.114 | 11,090 | 3.11 |
 Albania Albania |
34,422.5 | 11.993 | 14,927 | 2.306 |
 Croatia Croatia |
34,110 | 8.137 | 13,150 | 2.594 |
 Bulgaria Bulgaria |
31,020 | 4.4 | 13,010 | 2.384 |
 New Zealand New Zealand |
30,259 | 6.174 | 4,235 | 7.145 |
 Uruguay Uruguay |
29,951.78 | 8.543 | 13,500 | 2.219 |
 Bolivia Bolivia |
21,477.29 | 1.899 | 14,869 | 1.444 |
 Slovakia Slovakia |
20,330 | 3.735 | 9,690 | 2.098 |
 Mongolia Mongolia |
18,801.43 | 5.832 | 18,855 | 0.997 |
 Portugal Portugal |
14,620 | 1.421 | 20,390 | 0.717 |
 North Korea North Korea |
14,235.28 | 0.556 | 10,908 | 1.305 |
 Peru Peru |
12,968.14 | 0.415 | 10,014 | 1.295 |
 Switzerland Switzerland |
12,899 | 1.519 | 2,871 | 4.493 |
 Belgium Belgium |
11,440 | 1.002 | 2,930 | 3.904 |
 Armenia Armenia |
10,893.2 | 3.668 | 5,509 | 1.977 |
 Azerbaijan Azerbaijan |
10,179.1 | 1.028 | 4,984 | 2.042 |
 The Netherlands The Netherlands |
6,390 | 0.37 | 1,660 | 3.849 |
 Luxembourg Luxembourg |
4,790 | 7.957 | 1,340 | 3.575 |
 Macedonia Macedonia |
4,267 | 2.056 | 2,649 | 1.611 |
 Kenya Kenya |
3,748.64 | 0.074 | 3,702 | 1.013 |
 Tajikistan Tajikistan |
3,010.77 | 0.337 | 2,247 | 1.34 |
 Slovenia Slovenia |
2,510 | 1.214 | 870 | 2.885 |
 Moldova Moldova |
2,163 | 0.609 | 915 | 2.364 |
 Georgia Georgia |
1,700 | 0.456 | 800 | 2.125 |
 Tunisia Tunisia |
1,644.75 | 0.144 | 4,523 | 0.364 |
 Kyrgyzstan Kyrgyzstan |
1,298 | 0.206 | 753 | 1.724 |
 Ecuador Ecuador |
869.99 | 0.051 | 1,163 | 0.748 |
 Montenegro Montenegro |
617.31 | 0.992 | 226 | 2.731 |
 Zimbabwe Zimbabwe |
606.92 | 0.041 | 293 | 2.071 |
 Cyprus Cyprus |
410 | 0.48 | 300 | 1.367 |
 Lesotho Lesotho |
333.04 | 0.147 | 217 | 1.535 |
 Japan Japan |
314.93 | 0.002 | 163 | 1.932 |
 Israel Israel |
260.36 | 0.029 | 912 | 0.285 |
 Uzbekistan Uzbekistan |
254.1 | 0.008 | 150 | 1.694 |
 Lebanon Lebanon |
115.51 | 0.019 | 110 | 1.05 |
 Ghana Ghana |
40.5 | 0.001 | 43 | 0.942 |
 Syria Syria |
39 | 0.002 | 35 | 1.114 |
Top Oat Producing Countries by Share
- The Russian Federation accounts for over 17.5% of the global oat production, a considerable share that underscores its dominance in the market.
- Canada holds 14.0% of the global market, highlighting its importance in the oat supply chain.
- Poland contributes 8.0% to the worldwide production, solidifying its status as a major oat producer.
- Finland represents approximately 5.4% of global oat production, reflecting its efficient use of available agricultural resources in this sector.


