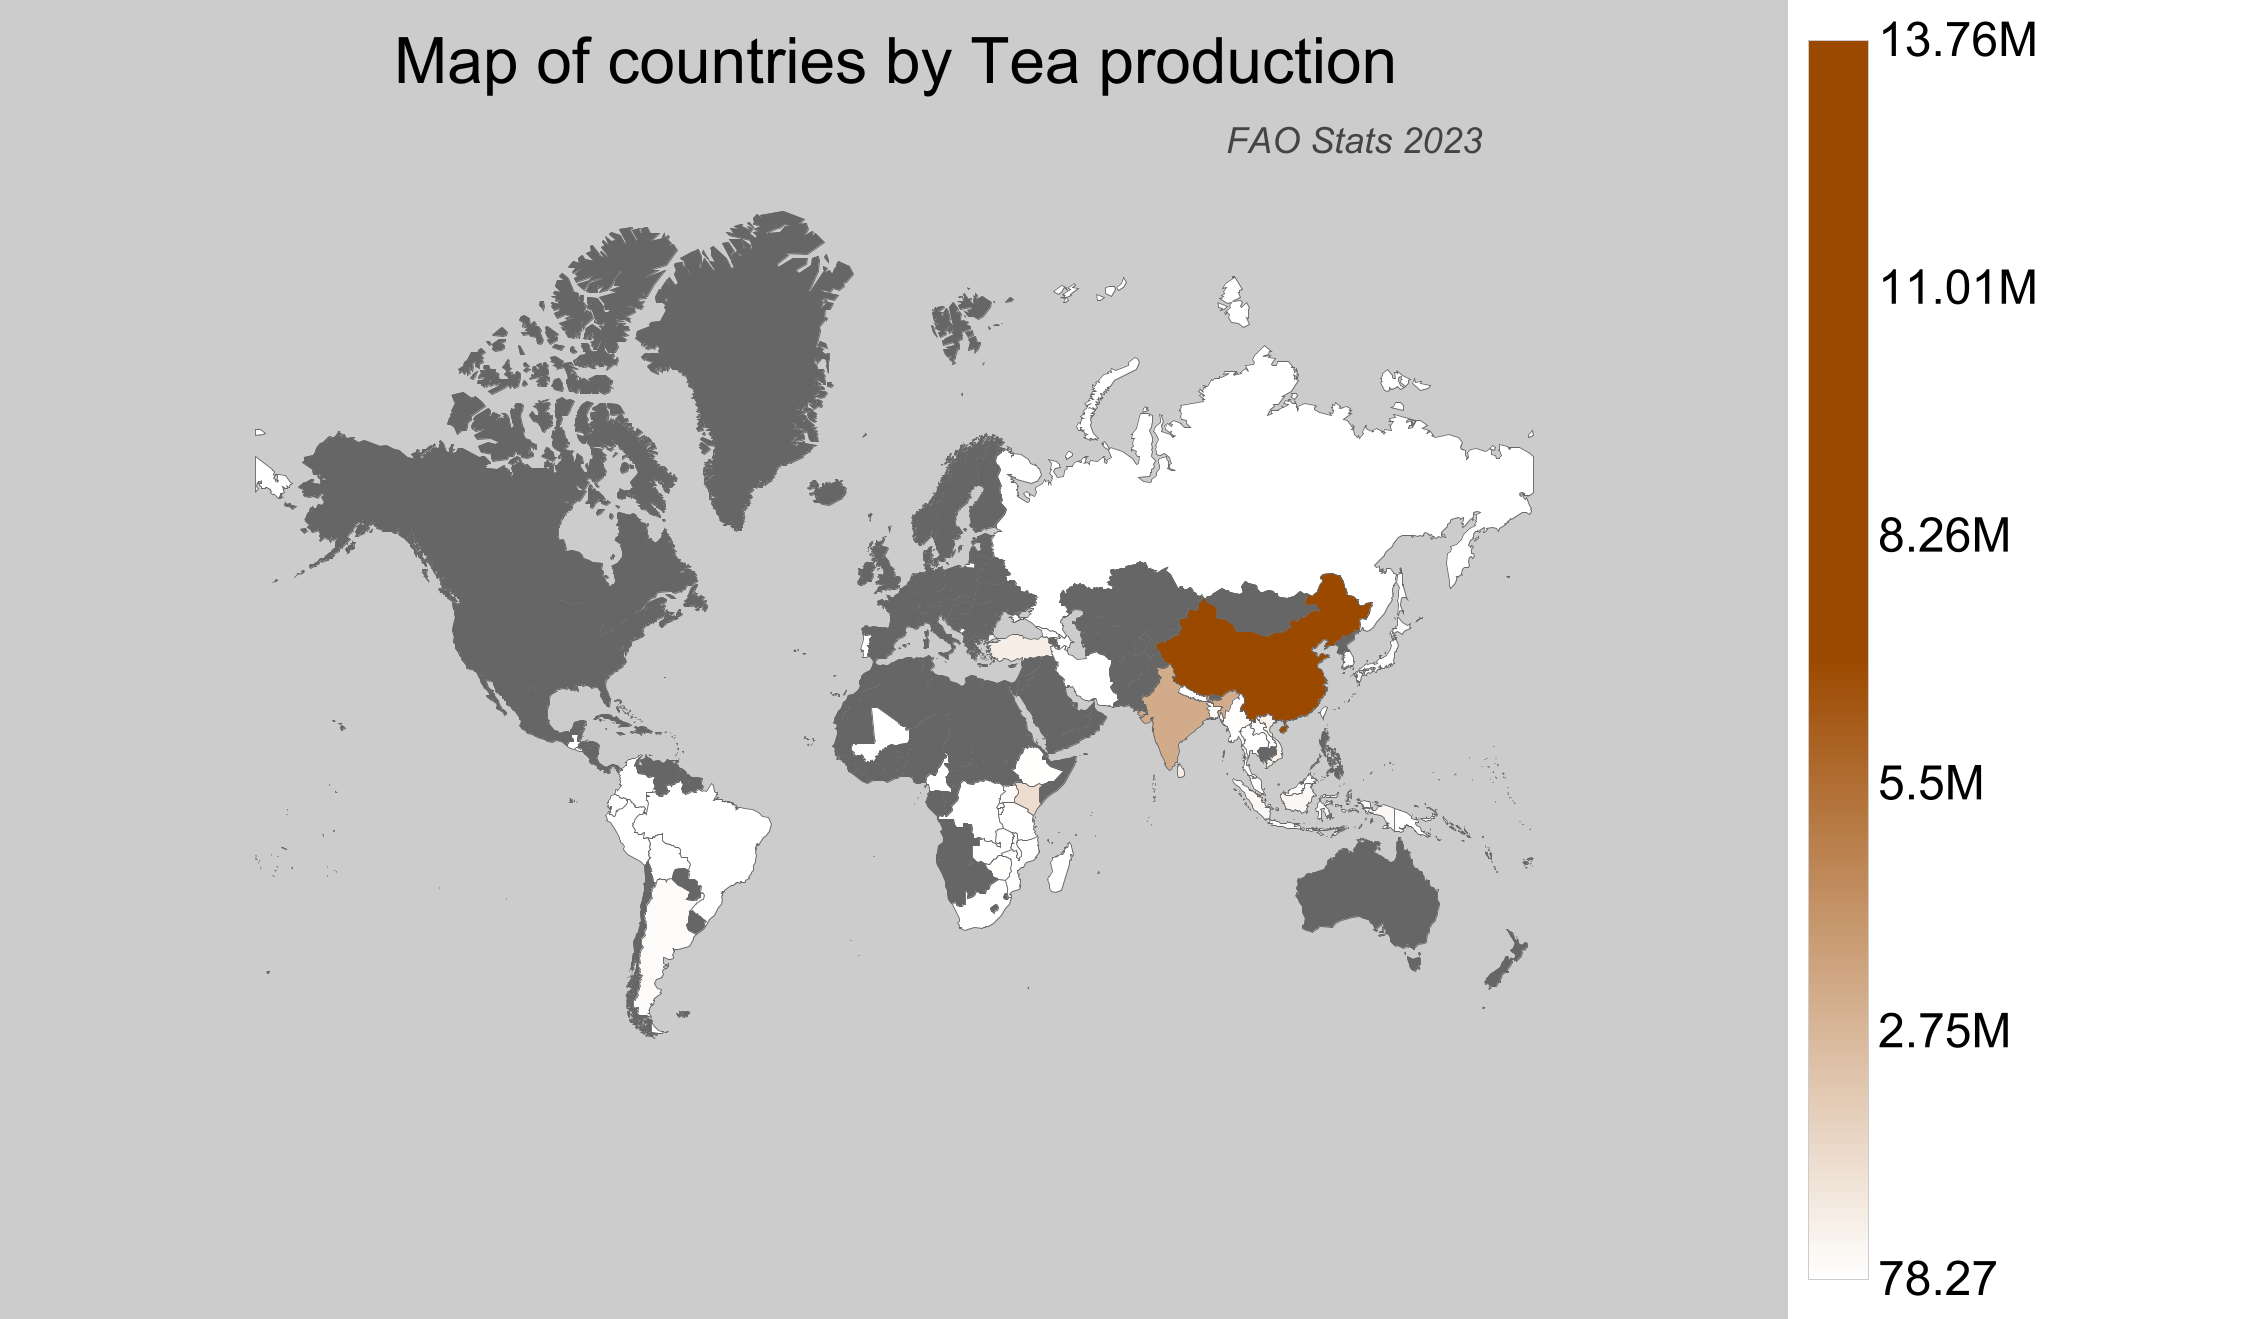
Countries by Tea production
Tea is one of the most widely consumed beverages across the globe, famous for its refreshing taste and potential health benefits. Grown mainly in tropical and subtropical climates, tea flourishes in regions with rich, well-drained soils and adequate rainfall. As of 2025, we present the latest available data from the Food and Agriculture Organization (FAO) stats database, covering global tea production for the year 2023.
Global Tea Production
In 2023, worldwide tea production reached approximately 32.2 million tonnes, continuing a trend of steady growth since 1961 when production was around 984 thousand tonnes. Over the decades, the tea industry has seen significant expansion, driven by increasing demand and improvements in agricultural practices. Notably, production has tripled from the levels seen in the early 1990s to the present day.
Tea Production by Country
- China leads the world in tea production, delivering approximately 13.8 million tonnes in 2023.
- India follows as the second-largest producer, with about 6.3 million tonnes produced.
- Kenya ranks third globally, contributing around 2.6 million tonnes.
- Sri Lanka is another key player with a production of approximately 1.4 million tonnes.
- According to FAO statistics, Canada does not produce any tea.
| Country | Production (tonnes) | Production per Person (kg) | Harvested Area (ha) | Yield (kg/ha) |
|---|---|---|---|---|
 China China |
13,768,883 | 9.878 | 3,390,951 | 4.06 |
 India India |
6,343,165.25 | 4.746 | 618,824 | 10.25 |
 Kenya Kenya |
2,577,800 | 50.594 | 227,800 | 11.316 |
 Sri Lanka Sri Lanka |
1,433,543.04 | 66.851 | 268,829 | 5.333 |
 Turkey Turkey |
1,356,556 | 15.89 | 79,198 | 17.129 |
 Vietnam Vietnam |
1,125,064.65 | 11.885 | 112,164 | 10.031 |
 Indonesia Indonesia |
647,000 | 2.441 | 99,757 | 6.486 |
 Bangladesh Bangladesh |
406,000 | 2.459 | 57,228 | 7.094 |
 Uganda Uganda |
390,493.99 | 10.058 | 43,684 | 8.939 |
 Argentina Argentina |
369,022.49 | 8.294 | 31,798 | 11.605 |
 Japan Japan |
303,166.34 | 2.397 | 36,000 | 8.421 |
 Malawi Malawi |
246,220.87 | 13.731 | 19,941 | 12.347 |
 Rwanda Rwanda |
165,003.49 | 13.749 | 31,909 | 5.171 |
 Nepal Nepal |
129,276.22 | 4.424 | 20,230 | 6.39 |
 Myanmar Myanmar |
118,087.22 | 2.192 | 92,638 | 1.275 |
 Thailand Thailand |
106,347 | 1.537 | 21,243 | 5.006 |
 Tanzania Tanzania |
103,000 | 1.9 | 14,677 | 7.018 |
 Iran Iran |
81,951.7 | 1.002 | 14,357 | 5.708 |
 Zimbabwe Zimbabwe |
66,219.27 | 4.46 | 5,662 | 11.695 |
 Burundi Burundi |
62,914.02 | 5.89 | 9,870 | 6.374 |
 Ethiopia Ethiopia |
61,449.28 | 0.571 | 5,602 | 10.969 |
 Laos Laos |
16,399.46 | 2.356 | 6,747 | 2.431 |
 Malaysia Malaysia |
15,867.92 | 0.486 | 1,987 | 7.986 |
 Taiwan Taiwan |
11,883 | 0.504 | 11,890 | 0.999 |
 Mozambique Mozambique |
6,801 | 0.236 | 5,868 | 1.159 |
 Mauritius Mauritius |
6,762 | 5.346 | 627 | 10.785 |
 Cameroon Cameroon |
5,591.06 | 0.235 | 2,111 | 2.649 |
 Papua New Guinea Papua New Guinea |
5,497.01 | 0.642 | 3,934 | 1.397 |
 Congo-Kinshasa Congo-Kinshasa |
2,907.2 | 0.036 | 27,312 | 0.106 |
 South Korea South Korea |
2,378.52 | 0.046 | 2,182 | 1.09 |
 Georgia Georgia |
2,300 | 0.617 | 2,135 | 1.077 |
 Brazil Brazil |
2,011 | 0.01 | 207 | 9.715 |
 Peru Peru |
1,944.22 | 0.062 | 2,033 | 0.956 |
 South Africa South Africa |
1,810.85 | 0.031 | 878 | 2.062 |
 Ecuador Ecuador |
1,572.42 | 0.092 | 844 | 1.863 |
 Bolivia Bolivia |
1,206.46 | 0.107 | 278 | 4.34 |
 Azerbaijan Azerbaijan |
1,123.8 | 0.114 | 734 | 1.531 |
 Zambia Zambia |
969.54 | 0.057 | 676 | 1.434 |
 El Salvador El Salvador |
674.03 | 0.101 | 343 | 1.965 |
 Guatemala Guatemala |
539.92 | 0.031 | 1,159 | 0.466 |
 Madagascar Madagascar |
400.59 | 0.015 | 1,052 | 0.381 |
 Colombia Colombia |
225.75 | 0.005 | 90 | 2.508 |
 Montenegro Montenegro |
100 | 0.161 | 124 | 0.806 |
 Mali Mali |
92.37 | 0.005 | 87 | 1.062 |
 Russian Federation Russian Federation |
82.03 | 0.001 | 278 | 0.295 |
 Portugal Portugal |
78.27 | 0.008 | 18 | 4.348 |
Top Tea Producing Countries by Share
- China dominates the global tea market, producing 42.8% of the world's total tea output.
- India accounts for nearly 19.7% of global tea production.
- Kenya contributes approximately 8% to the world's tea supply.
- Sri Lanka makes up about 4.5% of global tea production.
- Together, just these top producers account for a significant portion of the total global tea production.