Countries by Hop production
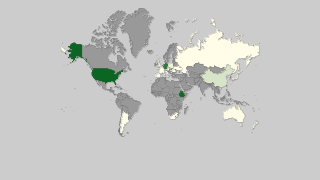
Hops are a key ingredient in brewing, providing the essential aroma and bitterness to beer. They thrive in temperate climates and are cultivated in regions with well-drained soil and suitable weather conditions. As a crucial element of the brewing industry, understanding hop production trends is vital. According to the latest data from the Food and Agriculture Organization (FAO) stats database, this information for the year 2023 provides a comprehensive overview of global hop production.
Global Hop Production
In 2023, global hop production reached approximately 167,000 tonnes, reflecting a notable increase from 69,670 tonnes in 1961. This growth signifies the rising demand for hops, driven by both the craft beer movement and traditional brewing industries. Noteworthy changes include the peak production witnessed in recent years, coupled with fluctuations influenced by agricultural developments and market demand.
Hop Production by Country
- The United States of America leads the global hop production with around 47,190 tonnes, making it a key player in the market.
- Ethiopia follows closely with a production volume of approximately 45,962 tonnes, highlighting its significant contribution to the global supply.
- Germany, known for its traditional brewing heritage, produced about 41,200 tonnes of hops.
- China also plays a role in global production with around 7,923 tonnes in 2023.
- According to FAO stats, Canada does not produce any hops, indicating a unique market dynamic for the country.
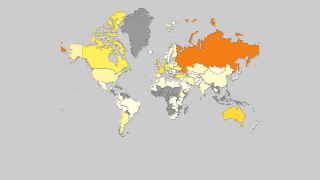
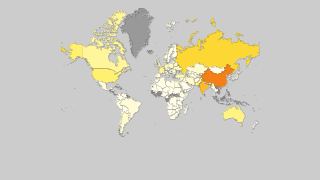
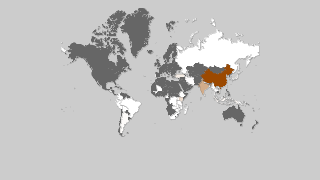
| Country | Production (tonnes) | Production per Person (kg) | Harvested Area (ha) | Yield (kg/ha) |
|---|---|---|---|---|
 United States of America United States of America |
47,190 | 0.144 | 21,980 | 2.147 |
 Ethiopia Ethiopia |
45,961.9 | 0.427 | 35,885 | 1.281 |
 Germany Germany |
41,200 | 0.498 | 20,900 | 1.971 |
 China China |
7,923.4 | 0.006 | 2,760 | 2.871 |
 Czech Republic Czech Republic |
7,000 | 0.66 | 4,860 | 1.44 |
 Poland Poland |
3,510 | 0.091 | 1,780 | 1.972 |
 Slovenia Slovenia |
2,740 | 1.326 | 1,660 | 1.651 |
 North Korea North Korea |
2,028.5 | 0.079 | 4,800 | 0.423 |
 Albania Albania |
1,813.5 | 0.632 | 2,390 | 0.759 |
 United Kingdom United Kingdom |
1,124.89 | 0.017 | 767 | 1.467 |
 Spain Spain |
960 | 0.021 | 620 | 1.548 |
 New Zealand New Zealand |
934.55 | 0.191 | 375 | 2.492 |
 France France |
720 | 0.011 | 550 | 1.309 |
 Japan Japan |
658.82 | 0.005 | 311 | 2.118 |
 Australia Australia |
619.39 | 0.025 | 264 | 2.346 |
 Argentina Argentina |
483.2 | 0.011 | 394 | 1.226 |
 South Africa South Africa |
471.3 | 0.008 | 403 | 1.169 |
 Ukraine Ukraine |
460 | 0.011 | 300 | 1.533 |
 Austria Austria |
380 | 0.043 | 280 | 1.357 |
 Belgium Belgium |
366.16 | 0.032 | 192 | 1.907 |
 Romania Romania |
180 | 0.009 | 220 | 0.818 |
 Russian Federation Russian Federation |
130.39 | 0.001 | 83 | 1.571 |
 Italy Italy |
110 | 0.002 | 60 | 1.833 |
 Slovakia Slovakia |
110 | 0.02 | 140 | 0.786 |
 Switzerland Switzerland |
37 | 0.004 | 21 | 1.762 |
 Serbia Serbia |
33.25 | 0.005 | 26 | 1.279 |
 Portugal Portugal |
20 | 0.002 | 10 | 2 |
Top Hop Producing Countries by Share
- The United States of America commands a substantial share of the global market with around 28.31% of the total production in 2023.
- Ethiopia contributes significantly with a share of approximately 27.57%, making it a prominent hop-producing nation.
- Germany accounts for about 24.71% of global hop production, reflecting its integral role in the industry.
- China holds a smaller share of 4.75%, yet still contributes to the overall global supply.
- With a few countries dominating a large portion of global production, the concentration in North America and Europe highlights the centralization of hop cultivation in specific regions.


