Countries by Coffee production
Coffee is a beloved beverage enjoyed by millions worldwide, known for its rich flavor and energizing effect. It thrives in tropical and subtropical climates, primarily in regions with consistent warmth and rainfall. This page delves into the global coffee production landscape, featuring data for the year 2023, sourced from the Food and Agriculture Organization (FAO) stats database, which is the most recent data available as of 2025.
Global Coffee Production
In 2023, global coffee production reached approximately 11.06 million tonnes. Over the years, production has shown a significant upward trend, increasing from around 4.5 million tonnes in 1961. This marks a substantial growth, reflecting both an increase in coffee demand worldwide and advancements in agricultural practices. Despite fluctuations in individual years, the upward trajectory remains strong.
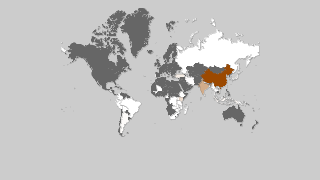
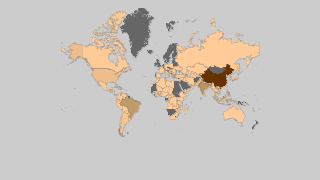
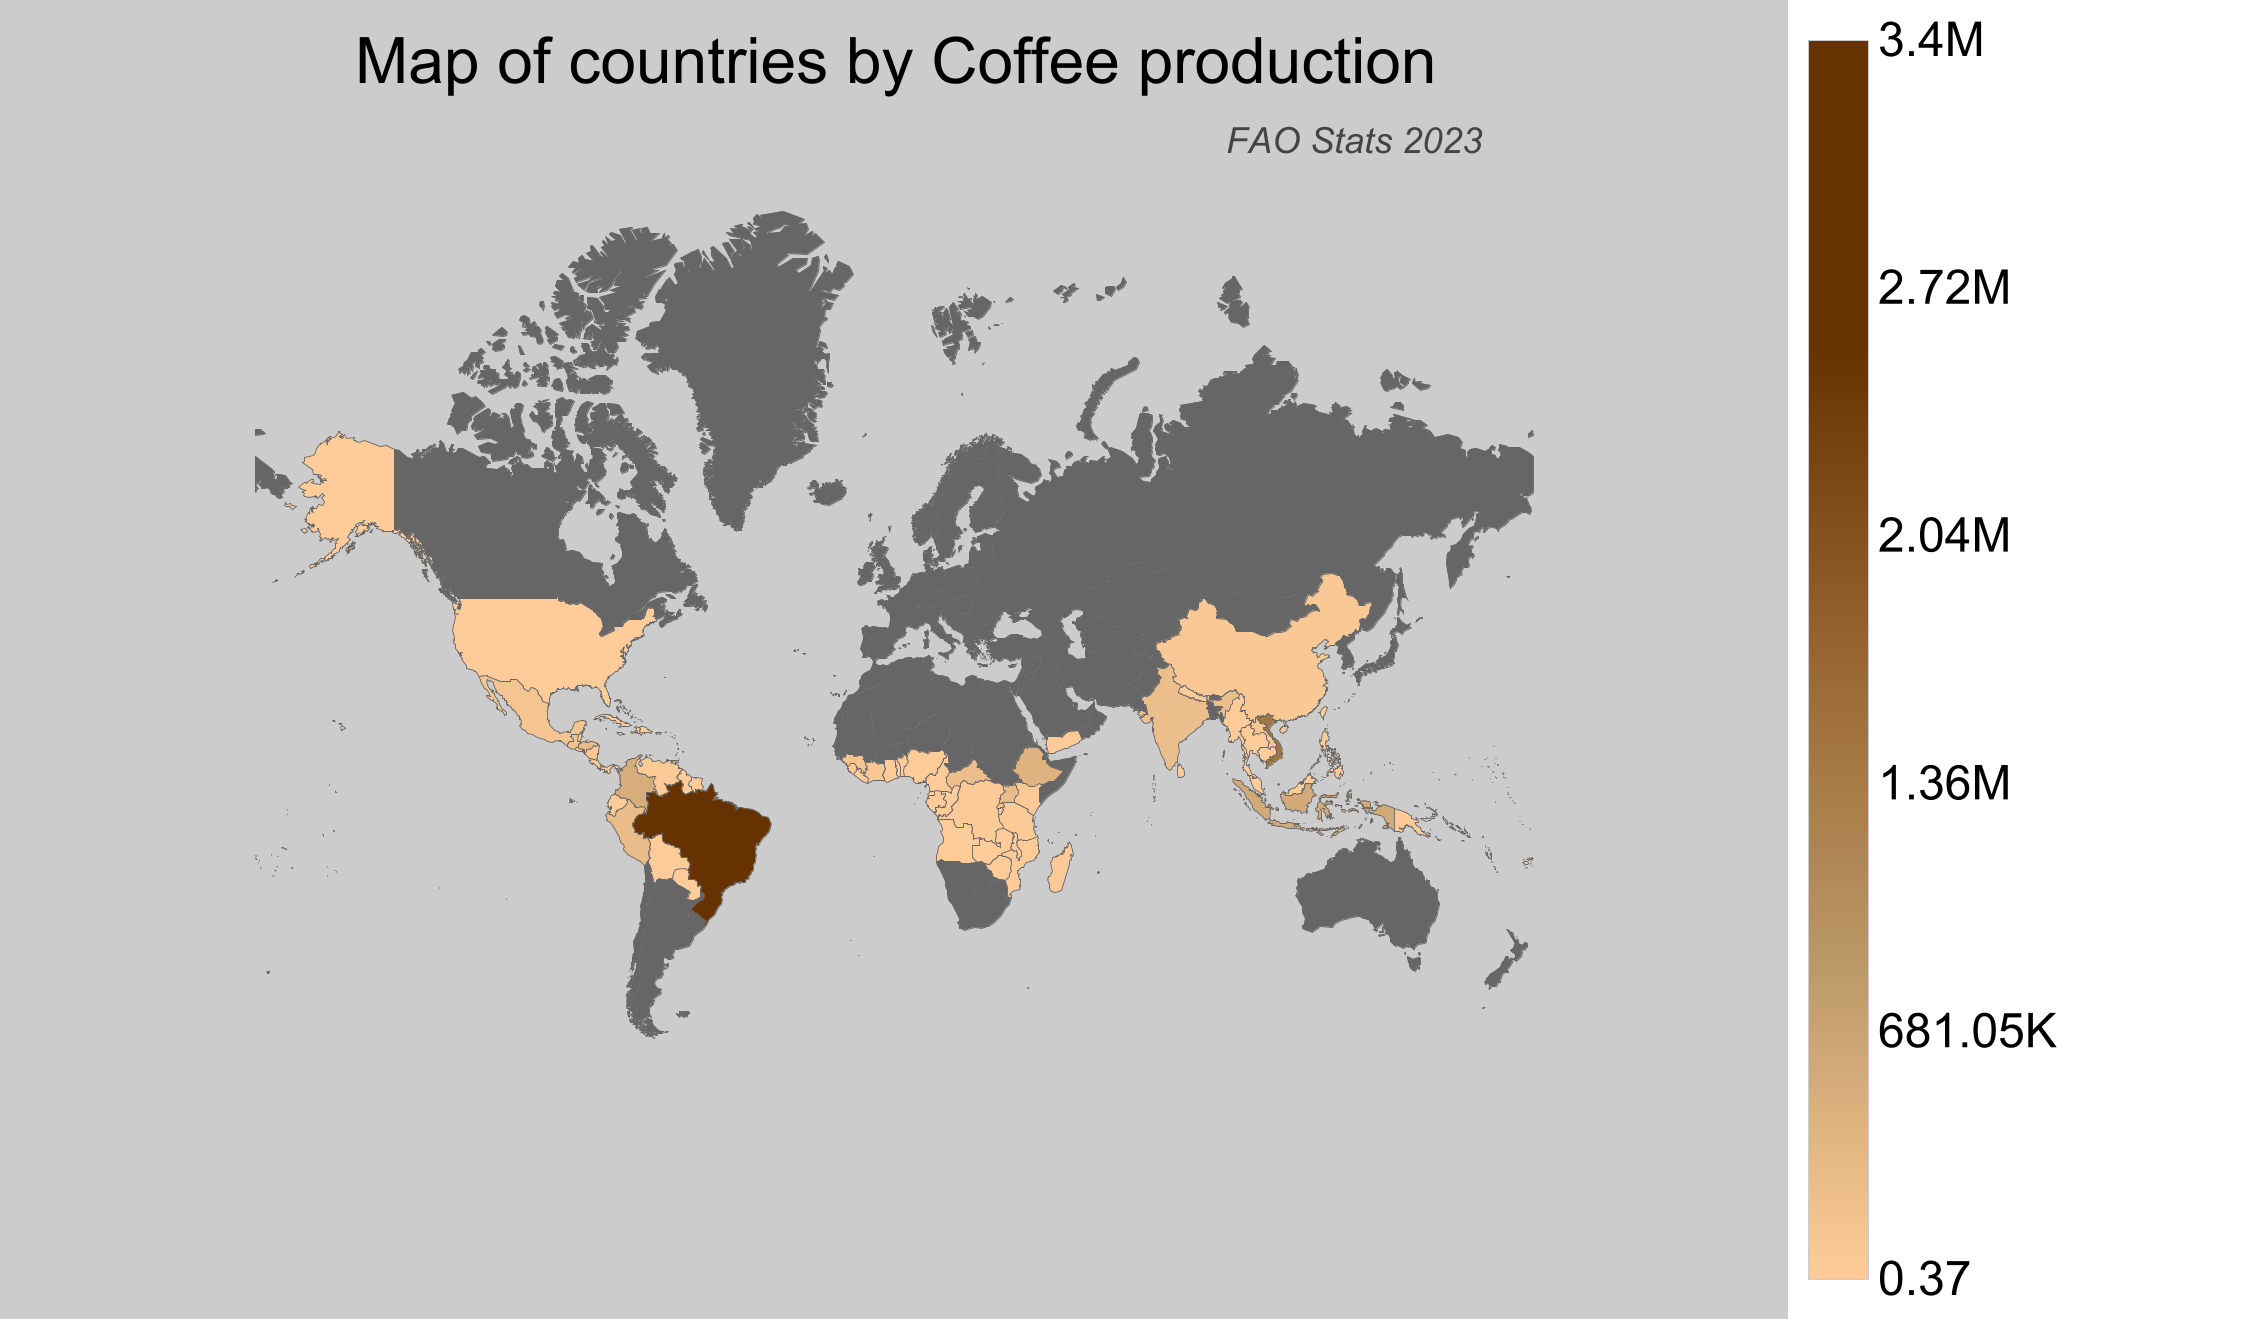
Coffee Production by Country
- Brazil leads with approximately 3.41 million tonnes of coffee production, maintaining its status as the top producer globally.
- Vietnam follows with a production of about 1.96 million tonnes, showcasing its robust coffee industry.
- Indonesia contributes around 760,000 tonnes to the global coffee supply, highlighting its significant role in the market.
- Colombia, known for its high-quality beans, produces approximately 681,000 tonnes.
- According to FAO stats, Canada does not produce any coffee, focusing instead on importing to meet domestic demand.
| Country | Production (tonnes) | Production per Person (kg) | Harvested Area (ha) | Yield (kg/ha) |
|---|---|---|---|---|
 Brazil Brazil |
3,405,267 | 16.252 | 1,920,889 | 1.773 |
 Vietnam Vietnam |
1,956,782.46 | 20.672 | 666,954 | 2.934 |
 Indonesia Indonesia |
760,192.2 | 2.868 | 1,268,905 | 0.599 |
 Colombia Colombia |
680,857.67 | 13.637 | 841,354 | 0.809 |
 Ethiopia Ethiopia |
559,400 | 5.202 | 844,389 | 0.662 |
 Honduras Honduras |
384,361.02 | 42.649 | 317,142 | 1.212 |
 Uganda Uganda |
384,000 | 9.891 | 701,580 | 0.547 |
 Peru Peru |
369,550.52 | 11.83 | 427,057 | 0.865 |
 India India |
332,848.31 | 0.249 | 437,862 | 0.76 |
 Central African Republic Central African Republic |
316,108 | 66.726 | 783,944 | 0.403 |
 Guatemala Guatemala |
225,327.29 | 13.023 | 260,890 | 0.864 |
 Guinea Guinea |
200,000 | 16.83 | 472,541 | 0.423 |
 Mexico Mexico |
194,916.12 | 1.563 | 654,693 | 0.298 |
 Laos Laos |
177,662.23 | 25.522 | 91,090 | 1.95 |
 Nicaragua Nicaragua |
143,336.66 | 22.807 | 148,393 | 0.966 |
 China China |
108,906 | 0.078 | 34,329 | 3.172 |
 Côte d'Ivoire Côte d'Ivoire |
91,326.79 | 3.667 | 665,957 | 0.137 |
 Costa Rica Costa Rica |
78,822 | 15.754 | 93,697 | 0.841 |
 Tanzania Tanzania |
62,917 | 1.161 | 244,438 | 0.257 |
 Congo-Kinshasa Congo-Kinshasa |
62,216.86 | 0.765 | 157,943 | 0.394 |
 Venezuela Venezuela |
56,380.58 | 1.771 | 166,077 | 0.339 |
 Madagascar Madagascar |
49,343.51 | 1.879 | 87,908 | 0.561 |
 Kenya Kenya |
48,700 | 0.956 | 111,900 | 0.435 |
 Papua New Guinea Papua New Guinea |
45,371.09 | 5.301 | 42,949 | 1.056 |
 El Salvador El Salvador |
32,326.39 | 4.866 | 111,230 | 0.291 |
 Yemen Yemen |
30,290.89 | 1.048 | 39,928 | 0.759 |
 Philippines Philippines |
30,023.39 | 0.282 | 112,890 | 0.266 |
 Rwanda Rwanda |
27,104.4 | 2.258 | 20,219 | 1.341 |
 Cameroon Cameroon |
24,266.35 | 1.02 | 50,337 | 0.482 |
 Bolivia Bolivia |
23,579.45 | 2.085 | 25,496 | 0.925 |
 Dominican Republic Dominican Republic |
23,446.25 | 2.284 | 42,035 | 0.558 |
 Togo Togo |
22,895.05 | 3.114 | 43,587 | 0.525 |
 Angola Angola |
20,071 | 0.686 | 59,699 | 0.336 |
 Thailand Thailand |
16,574.86 | 0.24 | 32,674 | 0.507 |
 Panama Panama |
12,760 | 3.068 | 28,306 | 0.451 |
 Malawi Malawi |
11,000 | 0.613 | 4,816 | 2.284 |
 Burundi Burundi |
9,900 | 0.927 | 10,835 | 0.914 |
 East Timor East Timor |
9,167.88 | 7.268 | 24,723 | 0.371 |
 Zambia Zambia |
8,786.74 | 0.52 | 8,118 | 1.082 |
 Myanmar Myanmar |
8,417.22 | 0.156 | 11,896 | 0.708 |
 Jamaica Jamaica |
8,152 | 2.987 | 9,640 | 0.846 |
 Cuba Cuba |
6,000 | 0.535 | 18,044 | 0.333 |
 Malaysia Malaysia |
5,995.95 | 0.184 | 3,025 | 1.982 |
 Ecuador Ecuador |
5,584.19 | 0.327 | 22,373 | 0.25 |
 Haiti Haiti |
5,046.87 | 0.454 | 9,795 | 0.515 |
 Sri Lanka Sri Lanka |
4,750 | 0.222 | 5,281 | 0.899 |
 Equatorial Guinea Equatorial Guinea |
4,091.67 | 3.347 | 11,139 | 0.367 |
 Sierra Leone Sierra Leone |
3,600 | 0.466 | 2,147 | 1.677 |
 Congo-Brazzaville Congo-Brazzaville |
3,237.71 | 0.6 | 10,518 | 0.308 |
 United States of America United States of America |
3,121 | 0.01 | 2,995 | 1.042 |
 Nigeria Nigeria |
1,844.06 | 0.009 | 1,416 | 1.302 |
 Taiwan Taiwan |
906 | 0.038 | 1,142 | 0.793 |
 Mozambique Mozambique |
794.86 | 0.028 | 834 | 0.953 |
 Trinidad and Tobago Trinidad and Tobago |
771.33 | 0.569 | 5,269 | 0.146 |
 Ghana Ghana |
736 | 0.025 | 460 | 1.6 |
 Zimbabwe Zimbabwe |
698.88 | 0.047 | 685 | 1.02 |
 Liberia Liberia |
625.27 | 0.143 | 2,656 | 0.235 |
 Nepal Nepal |
394.4 | 0.013 | 3,659 | 0.108 |
 Cambodia Cambodia |
364.83 | 0.023 | 461 | 0.791 |
 Dominica Dominica |
361.16 | 5.066 | 407 | 0.887 |
 Paraguay Paraguay |
267.33 | 0.038 | 201 | 1.33 |
 Saint Vincent and the Grenadines Saint Vincent and the Grenadines |
185.34 | 1.692 | 556 | 0.333 |
 Comoros Comoros |
143.76 | 0.169 | 989 | 0.145 |
 Guyana Guyana |
133 | 0.17 | 164 | 0.811 |
 Gabon Gabon |
103.9 | 0.05 | 273 | 0.381 |
 Belize Belize |
89.56 | 0.226 | 73 | 1.227 |
 Benin Benin |
55.09 | 0.005 | 283 | 0.195 |
 Cape Verde Cape Verde |
17.17 | 0.032 | 75 | 0.229 |
 Tonga Tonga |
15.05 | 0.15 | 11 | 1.368 |
 Vanuatu Vanuatu |
14.32 | 0.047 | 23 | 0.623 |
 Fiji Fiji |
14.25 | 0.016 | 22 | 0.648 |
 Samoa Samoa |
11.77 | 0.059 | 40 | 0.294 |
 São Tomé and Príncipe São Tomé and Príncipe |
7.57 | 0.038 | 130 | 0.058 |
 Suriname Suriname |
5.63 | 0.01 | 280 | 0.02 |
 Cook Islands Cook Islands |
0.37 | 0.02 | 1 | 0.37 |
Top Coffee Producing Countries by Share
- Brazil alone accounts for roughly 30.78% of the global coffee production, underscoring its dominant position in the industry.
- Vietnam holds 17.69% of the market share, reinforcing its standing as a major player.
- Indonesia and Colombia contribute 6.87% and 6.15%, respectively, of the total global production.
- Together, the top four producers dominate the coffee market, accounting for a significant share, while smaller producers cover the remainder.