Countries by Sunflower production
Sunflowers are not only beautiful but also play a crucial role in the global agricultural landscape. Known for their adaptability, sunflowers thrive in temperate climates with well-drained soil and full sunlight. These magnificent yellow giants are key contributors to the cooking oil industry and provide vital resources for livestock feed. As of 2025, the Food and Agriculture Organization (FAO) has documented the most recent data for 2023, shedding light on the global sunflower production landscape.
Global Sunflower Production
In 2023, the global production of sunflowers reached approximately 58.6 million tonnes. Over the decades, sunflower production has seen significant growth, from just 6.8 million tonnes in 1961. The latest figures indicate a robust increase, marking a nearly ninefold rise over this period. Such growth showcases the importance and demand for sunflower oil and related products worldwide.
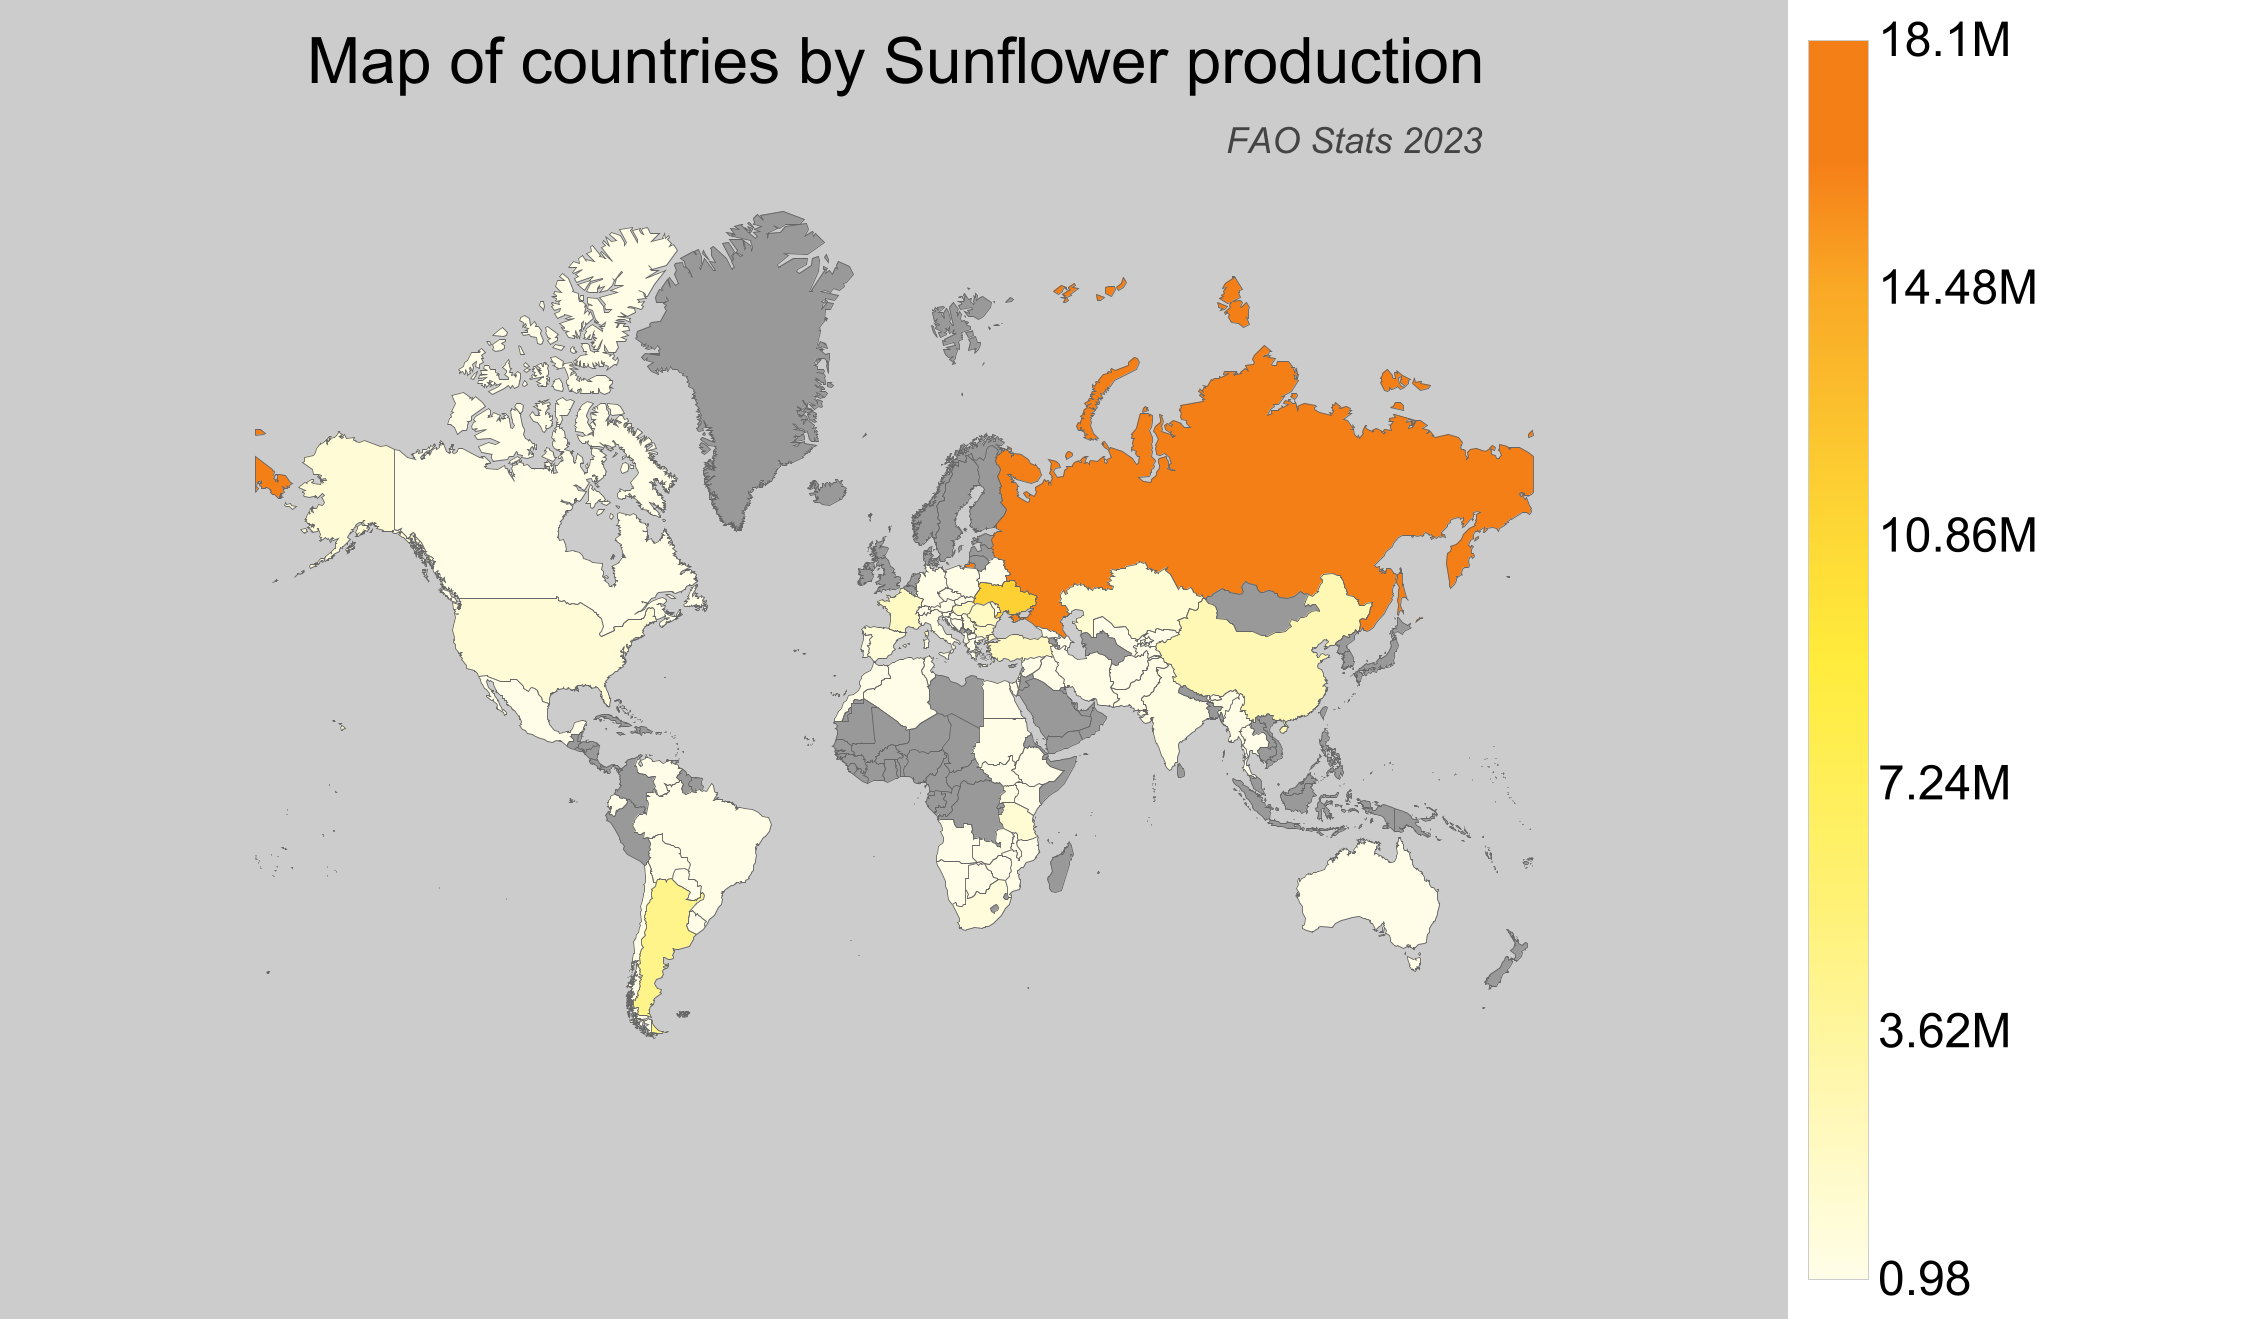
Sunflower Production by Country
- Russian Federation leads the global sunflower production with around 18.1 million tonnes in 2023.
- Ukraine secures the second spot, producing approximately 12.8 million tonnes of sunflowers.
- Argentina contributes significantly with a production of around 5 million tonnes.
- China also makes the top list with a production of 2.85 million tonnes.
- Canada, while not among the top producers, registered a production of approximately 92,468 tonnes, placing it at the 28th position globally.
| Country | Production (tonnes) | Production per Person (kg) | Harvested Area (ha) | Yield (kg/ha) |
|---|---|---|---|---|
 Russian Federation Russian Federation |
18,100,000 | 123.232 | 9,900,000 | 1.828 |
 Ukraine Ukraine |
12,759,690 | 301.905 | 5,201,600 | 2.453 |
 Argentina Argentina |
5,018,874 | 112.798 | 2,453,245 | 2.046 |
 China China |
2,850,000 | 2.045 | 940,000 | 3.032 |
 Turkey Turkey |
2,198,000 | 25.746 | 952,605 | 2.307 |
 France France |
2,061,430 | 30.632 | 821,740 | 2.509 |
 Romania Romania |
2,015,620 | 103.238 | 1,077,870 | 1.87 |
 Hungary Hungary |
1,970,150 | 201.632 | 674,200 | 2.922 |
 Bulgaria Bulgaria |
1,783,990 | 253.047 | 869,910 | 2.051 |
 Kazakhstan Kazakhstan |
1,236,443.74 | 67.667 | 1,127,114 | 1.097 |
 Tanzania Tanzania |
1,170,000 | 21.587 | 1,085,000 | 1.078 |
 United States of America United States of America |
1,026,720 | 3.132 | 512,940 | 2.002 |
 Spain Spain |
849,400 | 18.204 | 781,710 | 1.087 |
 Moldova Moldova |
758,274 | 213.544 | 390,022 | 1.944 |
 South Africa South Africa |
720,000 | 12.473 | 555,700 | 1.296 |
 Serbia Serbia |
686,268 | 98.018 | 240,520 | 2.853 |
 India India |
363,136.91 | 0.272 | 364,450 | 0.996 |
 Italy Italy |
307,320 | 5.085 | 122,460 | 2.51 |
 Uganda Uganda |
300,000 | 7.727 | 287,000 | 1.045 |
 Bolivia Bolivia |
180,539.54 | 15.967 | 172,029 | 1.049 |
 Slovakia Slovakia |
173,540 | 31.882 | 61,800 | 2.808 |
 Myanmar Myanmar |
170,940.96 | 3.174 | 185,108 | 0.923 |
 Germany Germany |
170,100 | 2.056 | 68,900 | 2.469 |
 Croatia Croatia |
157,620 | 37.599 | 59,900 | 2.631 |
 Greece Greece |
157,190 | 14.598 | 73,510 | 2.138 |
 Pakistan Pakistan |
133,188 | 0.66 | 75,832 | 1.756 |
 Sudan Sudan |
110,000 | 2.696 | 205,000 | 0.537 |
 Canada Canada |
92,468 | 2.485 | 39,800 | 2.323 |
 Zambia Zambia |
91,607.3 | 5.424 | 190,385 | 0.481 |
 Brazil Brazil |
87,051 | 0.415 | 53,757 | 1.619 |
 Austria Austria |
65,530 | 7.414 | 24,070 | 2.722 |
 Iran Iran |
65,000 | 0.795 | 62,000 | 1.048 |
 Poland Poland |
57,700 | 1.501 | 25,540 | 2.259 |
 South Sudan South Sudan |
52,882.33 | 4.291 | 30,449 | 1.737 |
 Czech Republic Czech Republic |
49,310 | 4.646 | 19,800 | 2.49 |
 Zimbabwe Zimbabwe |
40,700.12 | 2.741 | 87,295 | 0.466 |
 Paraguay Paraguay |
38,005 | 5.389 | 22,500 | 1.689 |
 Australia Australia |
37,045 | 1.479 | 25,115 | 1.475 |
 Morocco Morocco |
32,603.69 | 0.938 | 24,805 | 1.314 |
 Azerbaijan Azerbaijan |
28,178 | 2.847 | 9,899 | 2.847 |
 Uzbekistan Uzbekistan |
28,122.56 | 0.861 | 6,916 | 4.066 |
 Thailand Thailand |
27,000 | 0.39 | 32,000 | 0.844 |
 Egypt Egypt |
25,000 | 0.256 | 12,000 | 2.083 |
 Malawi Malawi |
22,000 | 1.227 | 20,000 | 1.1 |
 Switzerland Switzerland |
17,913 | 2.109 | 6,360 | 2.817 |
 Syria Syria |
14,636 | 0.8 | 9,816 | 1.491 |
 Tajikistan Tajikistan |
14,000 | 1.568 | 5,000 | 2.8 |
 Angola Angola |
12,321.7 | 0.421 | 17,342 | 0.711 |
 Uruguay Uruguay |
10,478 | 2.989 | 11,000 | 0.953 |
 Botswana Botswana |
9,997.92 | 4.341 | 12,890 | 0.776 |
 Mozambique Mozambique |
9,419 | 0.326 | 21,562 | 0.437 |
 Portugal Portugal |
8,730 | 0.848 | 4,710 | 1.854 |
 Tunisia Tunisia |
6,538.52 | 0.571 | 7,560 | 0.865 |
 Ethiopia Ethiopia |
6,352.17 | 0.059 | 5,626 | 1.129 |
 Kenya Kenya |
6,000 | 0.118 | 6,000 | 1 |
 Macedonia Macedonia |
5,950 | 2.867 | 4,764 | 1.249 |
 Venezuela Venezuela |
5,755.92 | 0.181 | 8,995 | 0.64 |
 Kyrgyzstan Kyrgyzstan |
5,449 | 0.864 | 4,126 | 1.321 |
 Mexico Mexico |
5,034.5 | 0.04 | 4,377 | 1.15 |
 Chile Chile |
4,650 | 0.265 | 3,722 | 1.249 |
 Belarus Belarus |
3,000 | 0.317 | 2,000 | 1.5 |
 Georgia Georgia |
2,600 | 0.697 | 2,500 | 1.04 |
 Bosnia and Herzegovina Bosnia and Herzegovina |
1,665 | 0.44 | 724 | 2.3 |
 Israel Israel |
1,600 | 0.18 | 398 | 4.02 |
 Slovenia Slovenia |
1,200 | 0.581 | 610 | 1.967 |
 Afghanistan Afghanistan |
1,067.94 | 0.034 | 1,000 | 1.068 |
 Albania Albania |
770 | 0.268 | 327 | 2.355 |
 Luxembourg Luxembourg |
440 | 0.731 | 290 | 1.517 |
 Iraq Iraq |
267 | 0.007 | 168 | 1.589 |
 Ecuador Ecuador |
230.61 | 0.014 | 129 | 1.788 |
 Algeria Algeria |
88.35 | 0.002 | 200 | 0.442 |
 Namibia Namibia |
69.6 | 0.029 | 63 | 1.105 |
 Bhutan Bhutan |
3.32 | 0.005 | 3 | 1.107 |
 Palestinian Territories Palestinian Territories |
0.98 | 0 | 1 | 0.98 |
Top Sunflower Producing Countries by Share
- Russian Federation dominates the global market, accounting for 30.9% of the total sunflower production.
- Ukraine follows closely with a substantial 21.8% share of global production.
- Argentina contributes 8.6%, showcasing its significant presence in the global market.
- China adds a 4.9% share, reinforcing its role as a key player in sunflower production.
- Together, these top producers represent the bulk of global sunflower output, highlighting the concentrated nature of production in a few countries.