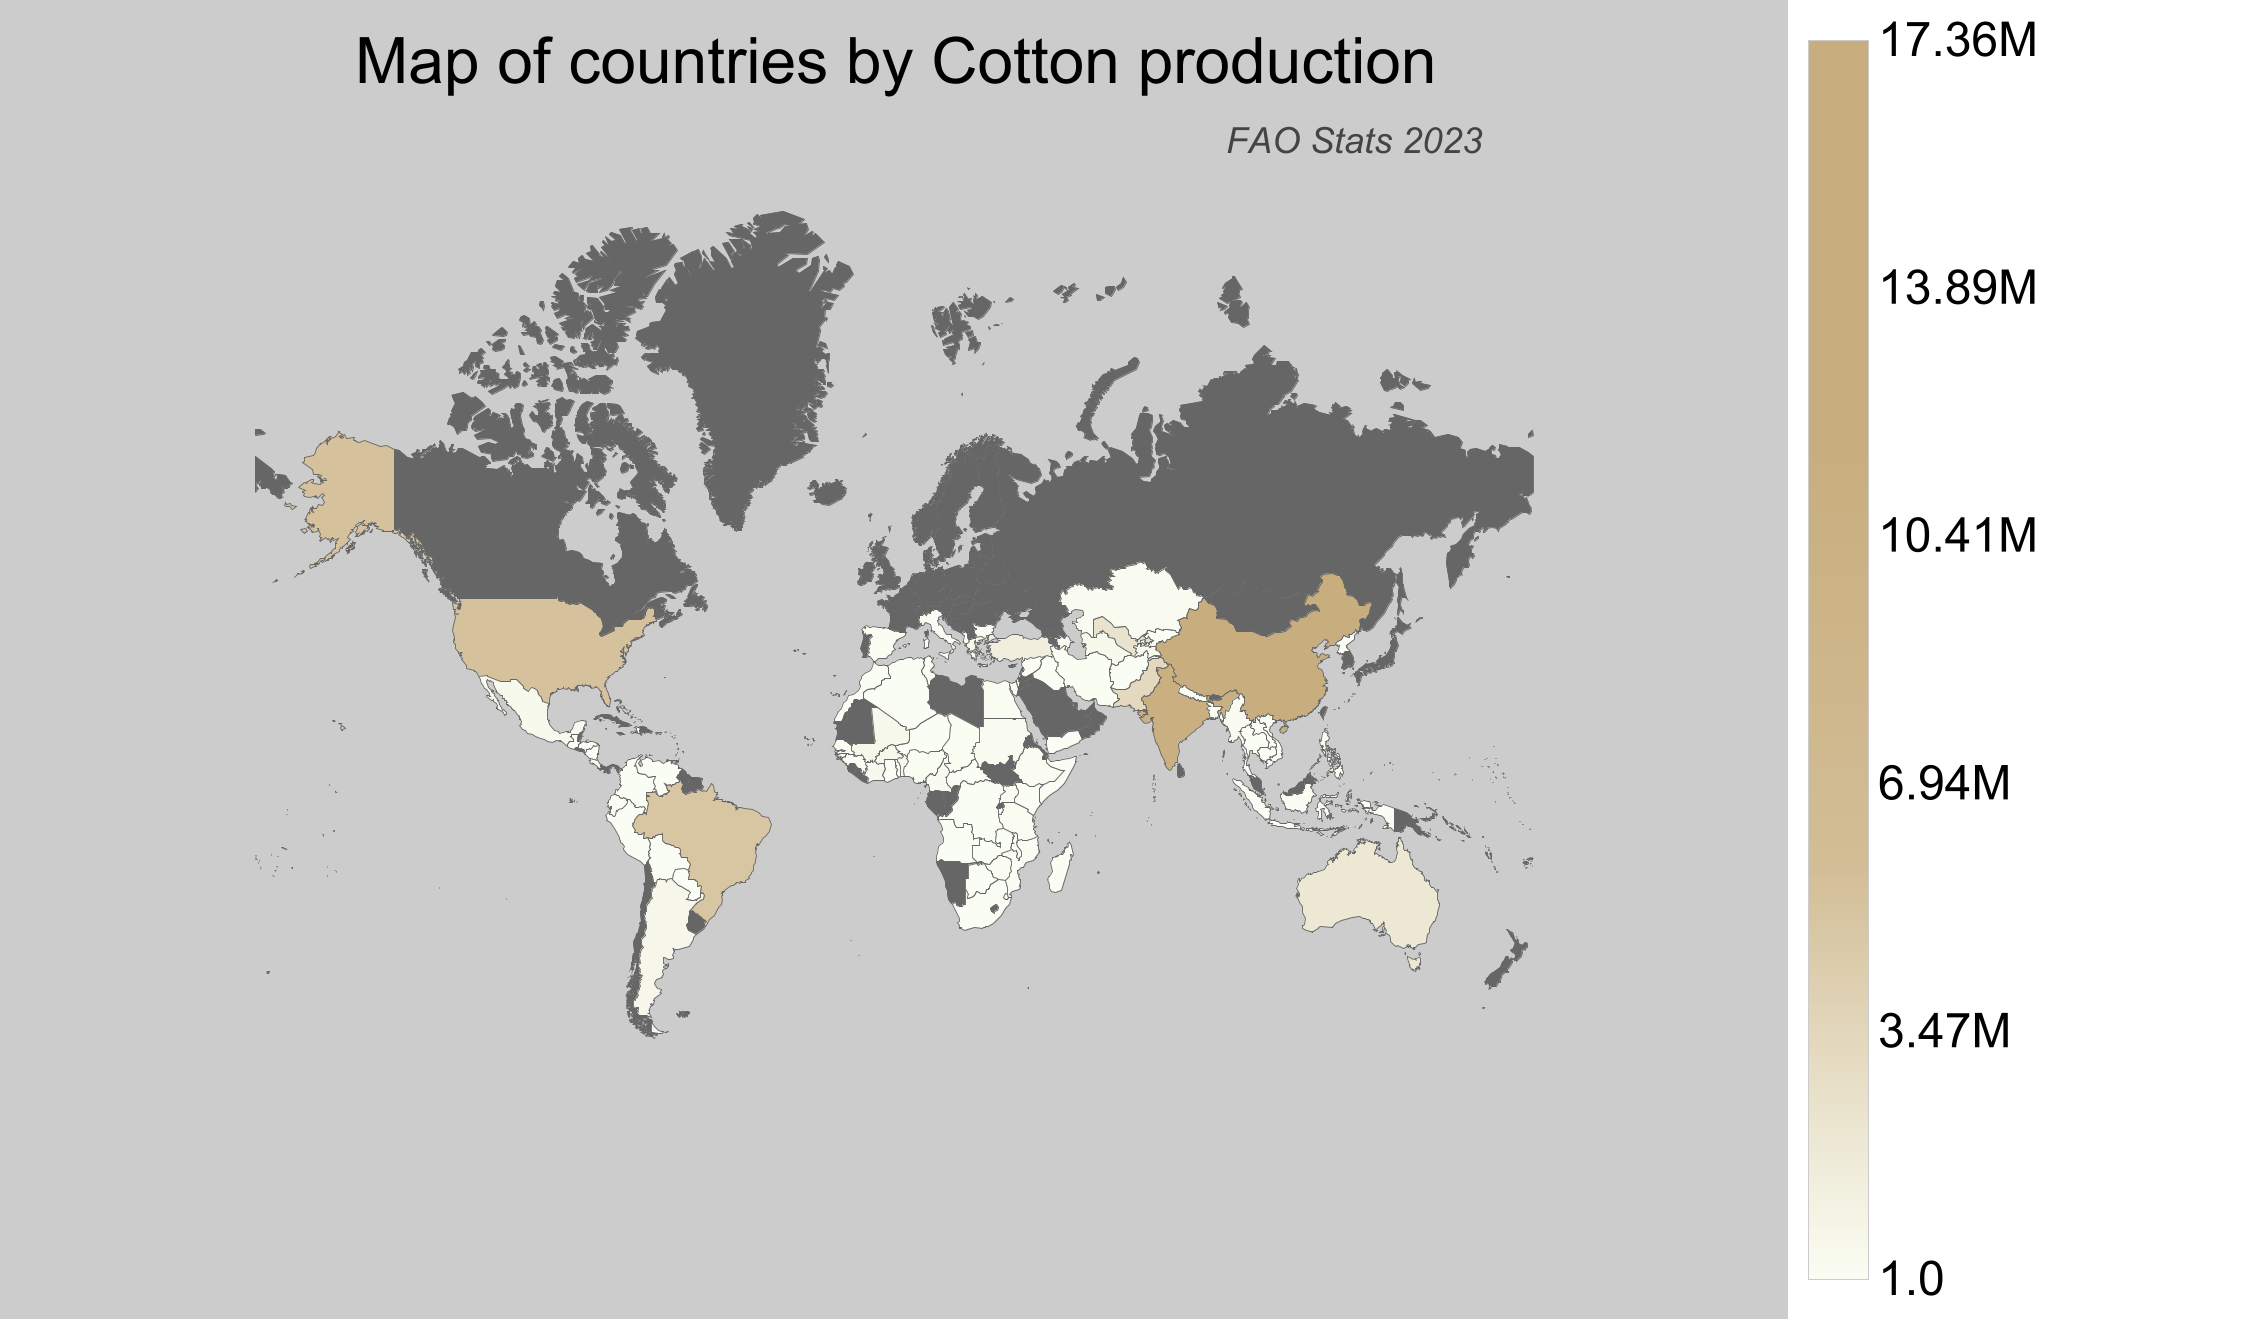
Countries by Cotton production
Cotton is a vital commodity, cherished worldwide for its versatility and economic significance. It thrives in warm climates and is predominantly grown in regions with long frost-free periods and plentiful sunshine. The 2023 data, sourced from the Food and Agriculture Organization (FAO) stats database as of 2025, highlights the significance of Cotton in global agriculture and trade.
Global Cotton Production
In 2023, the worldwide Cotton production reached around 74 million tonnes, highlighting a stable trend when compared to previous years. From 1961, production has progressed impressively from approximately 27 million tonnes. Noteworthy shifts include significant production spikes in the early 2000s. The global production fluctuates, often reflecting changes in major producing countries’ outputs.
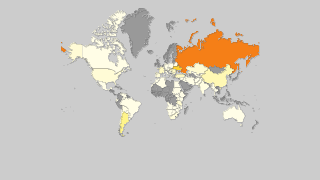
Cotton Production by Country
- China leads the world with an estimated production of around 17.4 million tonnes, showcasing its dominance in the Cotton production sector.
- India follows closely with about 16.4 million tonnes, cementing its position as a major Cotton producer.
- The United States of America ranks third, producing approximately 8.1 million tonnes.
- Brazil's Cotton output stands at roughly 7.5 million tonnes, reflecting its significant contribution to the global Cotton market.
- According to FAO statistics, Canada does not produce any Cotton.
| Country | Production (tonnes) | Production per Person (kg) | Harvested Area (ha) | Yield (kg/ha) |
|---|---|---|---|---|
 China China |
17,366,363 | 12.459 | 3,028,170 | 5.735 |
 India India |
16,400,000 | 12.271 | 12,926,801 | 1.269 |
 United States of America United States of America |
8,128,031.49 | 24.798 | 2,858,970 | 2.843 |
 Brazil Brazil |
7,496,603 | 35.778 | 1,709,425 | 4.385 |
 Pakistan Pakistan |
4,911,873 | 24.332 | 2,423,688 | 2.027 |
 Uzbekistan Uzbekistan |
3,710,292.65 | 113.625 | 1,035,942 | 3.582 |
 Australia Australia |
2,900,000 | 115.771 | 765,688 | 3.787 |
 Turkey Turkey |
2,100,000 | 24.598 | 477,438 | 4.398 |
 Argentina Argentina |
896,464 | 20.148 | 511,783 | 1.752 |
 Greece Greece |
847,389 | 78.694 | 262,821 | 3.224 |
 Burkina Faso Burkina Faso |
723,171.92 | 35.723 | 612,380 | 1.181 |
 Mali Mali |
685,000 | 35.849 | 710,000 | 0.965 |
 Turkmenistan Turkmenistan |
661,202 | 112.998 | 580,000 | 1.14 |
 Mexico Mexico |
604,127.69 | 4.843 | 133,691 | 4.519 |
 Benin Benin |
597,976.67 | 52.628 | 508,359 | 1.176 |
 Côte d'Ivoire Côte d'Ivoire |
545,996.09 | 21.922 | 500,000 | 1.092 |
 Cameroon Cameroon |
444,400 | 18.677 | 230,000 | 1.932 |
 Tajikistan Tajikistan |
386,500 | 43.276 | 175,700 | 2.2 |
 Myanmar Myanmar |
364,535.44 | 6.768 | 208,824 | 1.746 |
 Kazakhstan Kazakhstan |
327,733.5 | 17.936 | 116,600 | 2.811 |
 Sudan Sudan |
285,076.87 | 6.988 | 196,892 | 1.448 |
 Azerbaijan Azerbaijan |
276,310.9 | 27.916 | 93,672 | 2.95 |
 Nigeria Nigeria |
230,000 | 1.165 | 483,905 | 0.475 |
 Egypt Egypt |
220,000 | 2.256 | 120,000 | 1.833 |
 Zimbabwe Zimbabwe |
204,802.37 | 13.792 | 154,698 | 1.324 |
 Ethiopia Ethiopia |
174,576.73 | 1.623 | 82,810 | 2.108 |
 Tanzania Tanzania |
174,486 | 3.219 | 277,502 | 0.629 |
 Uganda Uganda |
139,849.24 | 3.602 | 96,000 | 1.457 |
 Iran Iran |
120,000 | 1.468 | 50,000 | 2.4 |
 Spain Spain |
115,408 | 2.473 | 51,823 | 2.227 |
 Chad Chad |
102,474.72 | 6.674 | 195,000 | 0.526 |
 Syria Syria |
93,846 | 5.133 | 35,896 | 2.614 |
 Afghanistan Afghanistan |
68,449.1 | 2.168 | 51,906 | 1.319 |
 Bangladesh Bangladesh |
65,000 | 0.394 | 14,930 | 4.354 |
 Kyrgyzstan Kyrgyzstan |
63,472 | 10.06 | 17,643 | 3.598 |
 Mozambique Mozambique |
57,772.38 | 2.002 | 95,097 | 0.608 |
 Zambia Zambia |
55,971.23 | 3.314 | 67,607 | 0.828 |
 Central African Republic Central African Republic |
52,457 | 11.073 | 118,109 | 0.444 |
 Togo Togo |
51,491.29 | 7.004 | 78,539 | 0.656 |
 Malawi Malawi |
47,000 | 2.621 | 76,115 | 0.617 |
 Guinea Guinea |
44,690.56 | 3.761 | 46,094 | 0.97 |
 South Africa South Africa |
43,265 | 0.749 | 17,664 | 2.449 |
 Peru Peru |
38,394.68 | 1.229 | 13,429 | 2.859 |
 Israel Israel |
38,000 | 4.266 | 12,195 | 3.116 |
 Paraguay Paraguay |
37,410 | 5.304 | 18,640 | 2.007 |
 North Korea North Korea |
36,150.29 | 1.412 | 18,345 | 1.971 |
 Congo-Kinshasa Congo-Kinshasa |
30,344.07 | 0.373 | 73,330 | 0.414 |
 Colombia Colombia |
30,248 | 0.606 | 12,561 | 2.408 |
 Ghana Ghana |
27,465.54 | 0.927 | 15,000 | 1.831 |
 Senegal Senegal |
19,000 | 1.208 | 17,000 | 1.118 |
 Madagascar Madagascar |
14,261.42 | 0.543 | 13,013 | 1.096 |
 Bolivia Bolivia |
7,700 | 0.681 | 3,860 | 1.995 |
 Somalia Somalia |
7,426.57 | 0.489 | 18,474 | 0.402 |
 Nicaragua Nicaragua |
7,179.75 | 1.142 | 2,000 | 3.59 |
 Niger Niger |
6,000 | 0.28 | 3,488 | 1.72 |
 Tunisia Tunisia |
5,806.39 | 0.507 | 2,387 | 2.433 |
 Guinea-Bissau Guinea-Bissau |
5,423 | 3.422 | 4,985 | 1.088 |
 Yemen Yemen |
5,235.75 | 0.181 | 5,468 | 0.958 |
 Ecuador Ecuador |
3,932.11 | 0.23 | 3,053 | 1.288 |
 Kenya Kenya |
3,864 | 0.076 | 12,152 | 0.318 |
 Thailand Thailand |
3,800 | 0.055 | 2,300 | 1.652 |
 Angola Angola |
3,400 | 0.116 | 3,255 | 1.045 |
 Honduras Honduras |
3,298.99 | 0.366 | 1,919 | 1.719 |
 Guatemala Guatemala |
2,622.55 | 0.152 | 941 | 2.787 |
 Venezuela Venezuela |
1,847.29 | 0.058 | 1,579 | 1.17 |
 Swaziland Swaziland |
1,697.4 | 1.464 | 2,697 | 0.629 |
 Bulgaria Bulgaria |
1,462 | 0.207 | 2,354 | 0.621 |
 Laos Laos |
1,380.14 | 0.198 | 995 | 1.387 |
 Burundi Burundi |
1,050.11 | 0.098 | 2,504 | 0.419 |
 Botswana Botswana |
984.71 | 0.428 | 508 | 1.938 |
 Haiti Haiti |
952.9 | 0.086 | 1,933 | 0.493 |
 Albania Albania |
803.22 | 0.28 | 725 | 1.108 |
 Costa Rica Costa Rica |
700.2 | 0.14 | 877 | 0.798 |
 Gambia Gambia |
532.57 | 0.26 | 1,615 | 0.33 |
 Cambodia Cambodia |
234.3 | 0.015 | 181 | 1.294 |
 Morocco Morocco |
213.02 | 0.006 | 106 | 2.01 |
 Nepal Nepal |
131.06 | 0.004 | 131 | 1 |
 Indonesia Indonesia |
123 | 0 | 532 | 0.231 |
 Antigua and Barbuda Antigua and Barbuda |
105.5 | 1.223 | 584 | 0.181 |
 Italy Italy |
100 | 0.002 | 47 | 2.128 |
 Algeria Algeria |
81.33 | 0.002 | 260 | 0.313 |
 Philippines Philippines |
80 | 0.001 | 42 | 1.905 |
 Grenada Grenada |
53.19 | 0.515 | 155 | 0.343 |
 Vietnam Vietnam |
20.97 | 0 | 46 | 0.456 |
 Saint Kitts and Nevis Saint Kitts and Nevis |
3.01 | 0.065 | 10 | 0.301 |
 Iraq Iraq |
1 | 0 | 1 | 1 |
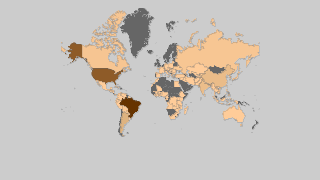
Top Cotton Producing Countries by Share
- China contributes to approximately 23.4% of the global Cotton production, highlighting its prominent role in the market.
- India accounts for about 22.1% of the worldwide production, making it a key player in the industry.
- The United States of America holds around 10.9% of the global share, showing its substantial involvement.
- Brazil contributes to 10.1% of the world's Cotton supply.
- The combined production of these top countries represents a significant portion of global output, emphasizing their influence on the Cotton industry.