Countries by Soybean production
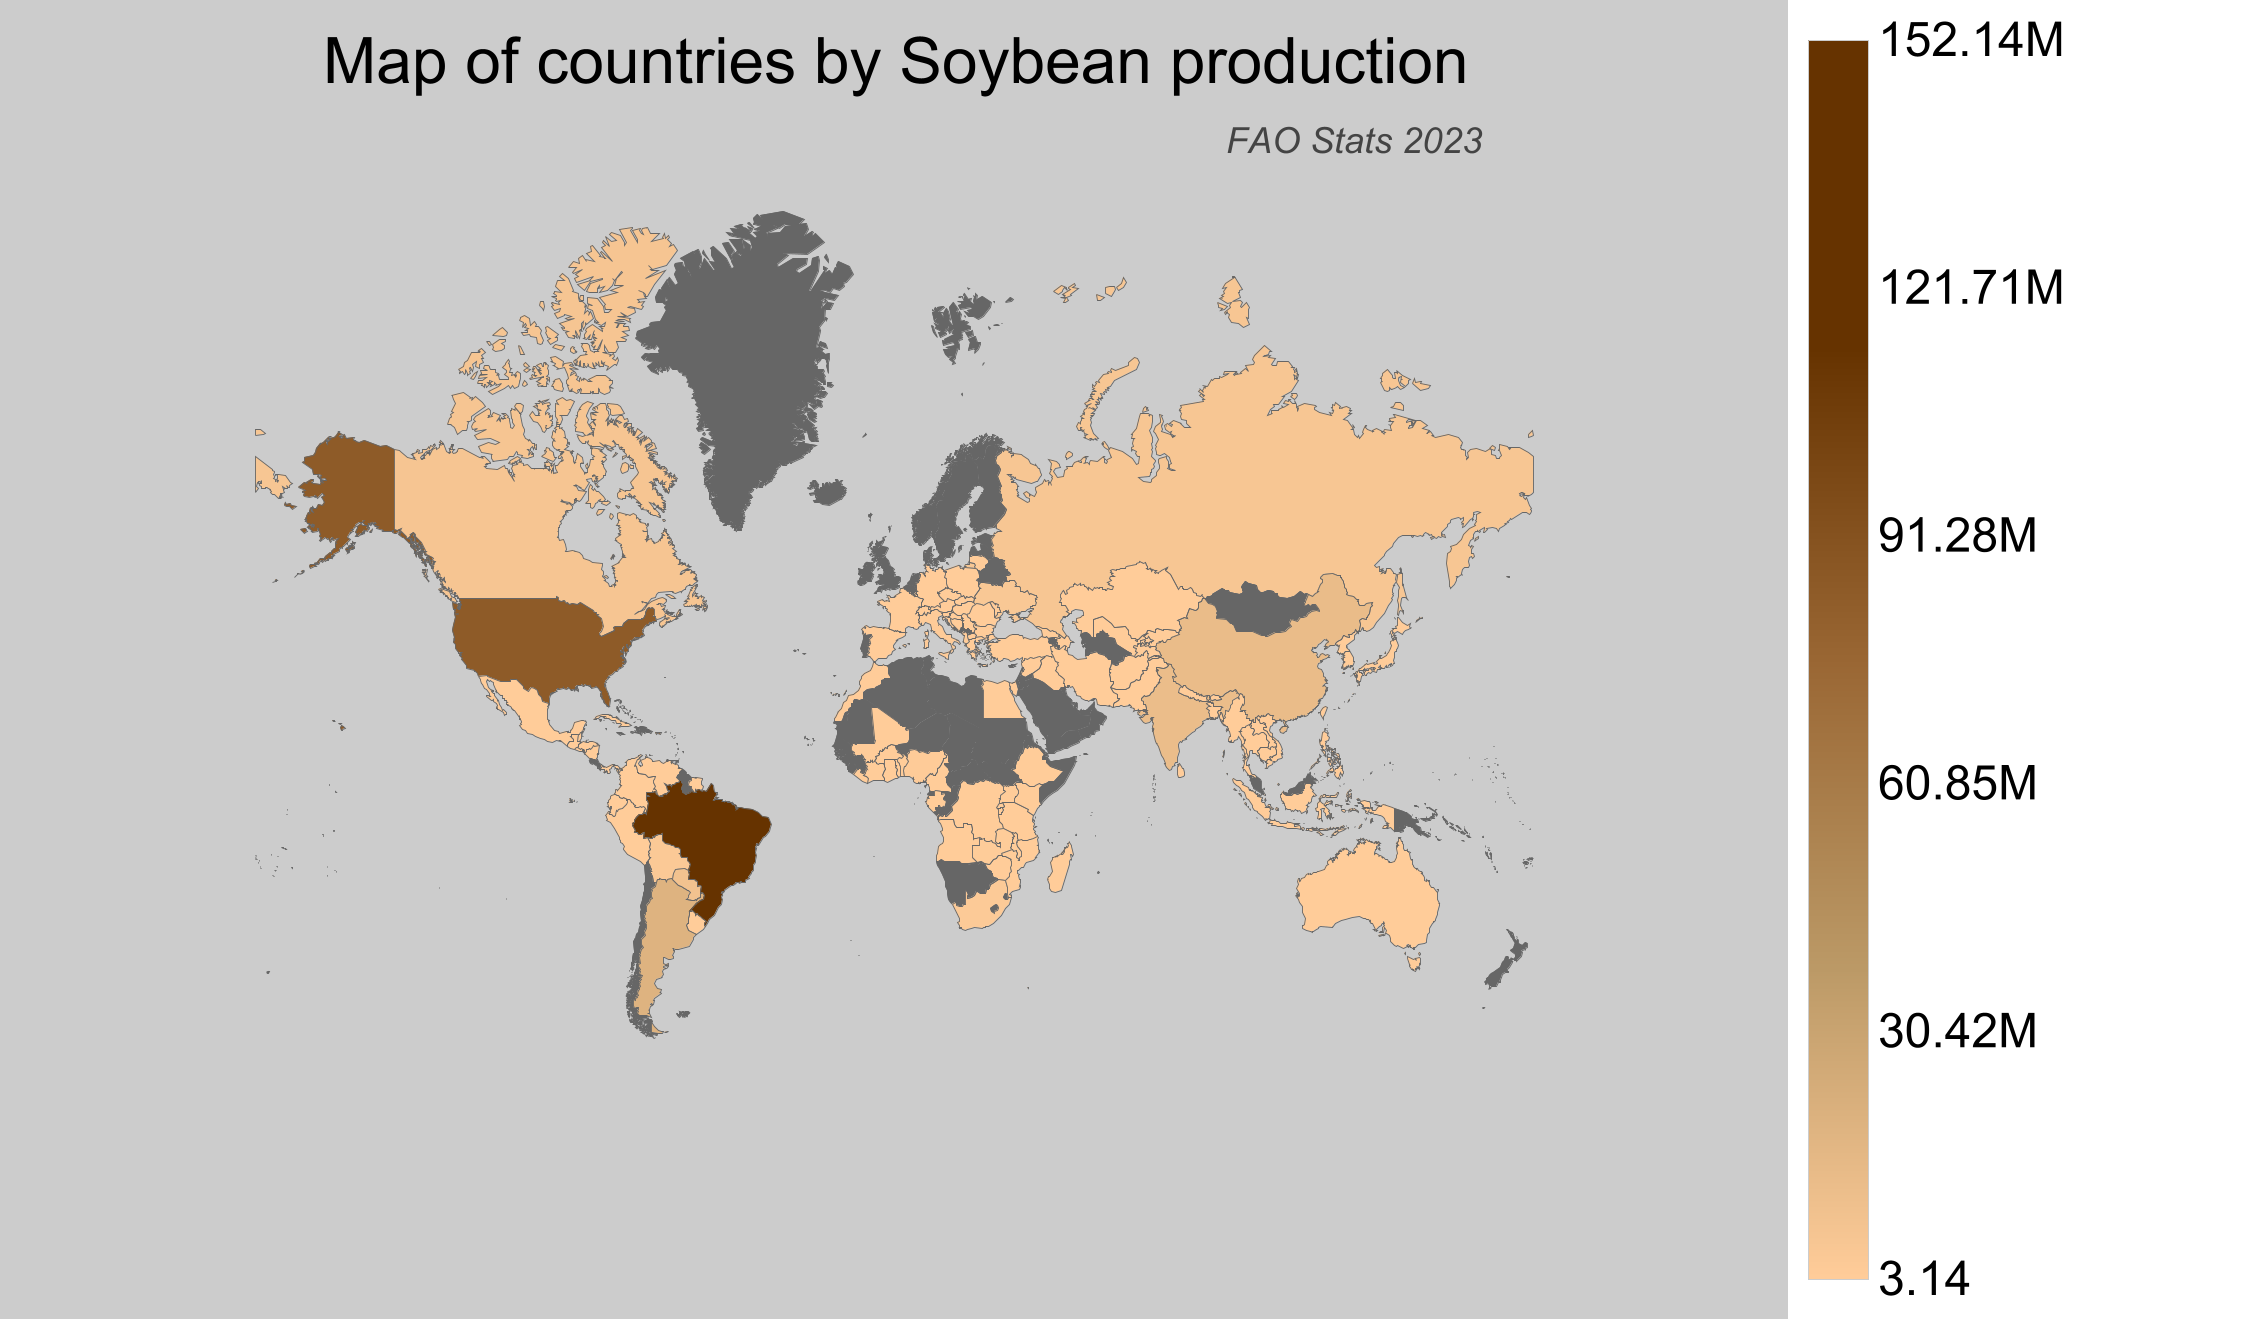
Soybean is a vital crop in global agriculture, providing protein-rich food for humans and animals. It thrives in temperate climates with adequate rainfall and typically grows in regions conducive to cultivation, namely across North and South America and parts of Asia. According to the latest 2023 Food and Agriculture Organization (FAO) stats, the global Soybean production data offers crucial insights into agricultural trends and economic impacts as of 2025.
Global Soybean Production
In 2023, global Soybean production reached around 371 million tonnes. Over the years, a significant rising trend in production is evident, with a growth from about 27 million tonnes in 1961 to the current levels. The trend indicates increasing demand and improvements in agricultural practices. Notably, production surged dramatically in the early 21st century, reflecting technological and hybrid advancements in key producing regions.
Soybean Production by Country
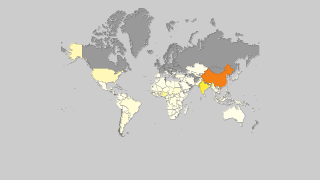
- Brazil is the leading producer with approximately 152 million tonnes of Soybeans in 2023.
- The United States of America follows closely, producing around 113 million tonnes.
- Argentina ranks third, contributing roughly 25 million tonnes to global production.
- China produced about 16 million tonnes, bolstering its position as a significant producer.
- Canada, not among the top four, produced approximately 7 million tonnes, showcasing its growing role in global Soybean agriculture.
| Country | Production (tonnes) | Production per Person (kg) | Harvested Area (ha) | Yield (kg/ha) |
|---|---|---|---|---|
 Brazil Brazil |
152,144,238 | 726.111 | 44,447,552 | 3.423 |
 United States of America United States of America |
113,343,420 | 345.807 | 33,348,650 | 3.399 |
 Argentina Argentina |
25,044,978 | 562.878 | 14,356,922 | 1.744 |
 China China |
16,404,194 | 11.769 | 8,403,376 | 1.952 |
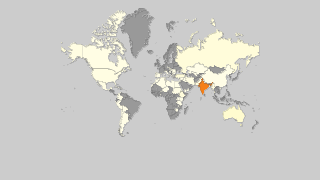
 India India |
14,984,927.37 | 11.212 | 13,084,089 | 1.145 |
 Paraguay Paraguay |
10,197,050 | 1,445.778 | 3,608,000 | 2.826 |
 Canada Canada |
6,980,525 | 187.58 | 2,261,200 | 3.087 |
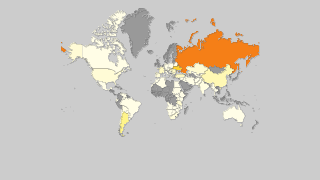
 Russian Federation Russian Federation |
6,600,000 | 44.936 | 3,500,000 | 1.886 |
 Ukraine Ukraine |
4,742,550 | 112.213 | 1,834,000 | 2.586 |
 Bolivia Bolivia |
3,670,464.34 | 324.61 | 1,824,029 | 2.012 |
 South Africa South Africa |
2,770,000 | 47.986 | 1,148,300 | 2.412 |
 Nigeria Nigeria |
1,350,000 | 6.839 | 1,200,000 | 1.125 |
 Italy Italy |
1,095,940 | 18.134 | 310,720 | 3.527 |
 Zambia Zambia |
760,067.09 | 45.007 | 603,903 | 1.259 |
 Uruguay Uruguay |
647,800 | 184.77 | 1,009,900 | 0.641 |
 Serbia Serbia |
599,878 | 85.679 | 211,020 | 2.843 |
 Benin Benin |
520,928.9 | 45.847 | 518,961 | 1.004 |
 France France |
387,820 | 5.763 | 157,750 | 2.458 |
 Malawi Malawi |
350,000 | 19.519 | 255,000 | 1.373 |
 Indonesia Indonesia |
326,493 | 1.232 | 219,193 | 1.49 |
 Romania Romania |
320,800 | 16.431 | 141,660 | 2.265 |
 Austria Austria |
274,960 | 31.111 | 88,450 | 3.109 |
 Togo Togo |
273,276.21 | 37.17 | 273,257 | 1 |
 Japan Japan |
260,800 | 2.062 | 154,700 | 1.686 |
 Ghana Ghana |
260,000 | 8.78 | 140,000 | 1.857 |
 Ethiopia Ethiopia |
220,000 | 2.046 | 90,000 | 2.444 |
 Croatia Croatia |
213,020 | 50.815 | 76,690 | 2.778 |
 Kazakhstan Kazakhstan |
203,922.15 | 11.16 | 99,512 | 2.049 |
 Mexico Mexico |
199,162.6 | 1.597 | 91,116 | 2.186 |
 Colombia Colombia |
196,414 | 3.934 | 85,540 | 2.296 |
 Iran Iran |
190,000 | 2.324 | 79,000 | 2.405 |
 North Korea North Korea |
180,000 | 7.028 | 156,000 | 1.154 |
 Hungary Hungary |
173,310 | 17.737 | 58,140 | 2.981 |
 Uganda Uganda |
150,000 | 3.864 | 210,000 | 0.714 |
 South Korea South Korea |
141,477 | 2.74 | 67,671 | 2.091 |
 Myanmar Myanmar |
137,699.33 | 2.556 | 132,960 | 1.036 |
 Turkey Turkey |
137,500 | 1.611 | 32,684 | 4.207 |
 Slovakia Slovakia |
132,810 | 24.4 | 50,150 | 2.648 |
 Mozambique Mozambique |
130,000 | 4.504 | 80,000 | 1.625 |
 Burkina Faso Burkina Faso |
129,224.68 | 6.383 | 122,794 | 1.052 |
 Germany Germany |
129,000 | 1.559 | 44,800 | 2.879 |
 Cameroon Cameroon |
108,752.92 | 4.571 | 61,990 | 1.754 |
 Bangladesh Bangladesh |
107,307 | 0.65 | 58,940 | 1.821 |
 Zimbabwe Zimbabwe |
69,291 | 4.666 | 37,658 | 1.84 |
 Czech Republic Czech Republic |
63,390 | 5.973 | 26,510 | 2.391 |
 Egypt Egypt |
60,000 | 0.615 | 20,000 | 3 |
 Australia Australia |
52,000 | 2.076 | 20,700 | 2.512 |
 Cambodia Cambodia |
49,000 | 3.049 | 34,000 | 1.441 |
 Vietnam Vietnam |
48,102.94 | 0.508 | 29,946 | 1.606 |
 Poland Poland |
47,030 | 1.224 | 18,020 | 2.61 |
 Angola Angola |
44,640 | 1.526 | 42,920 | 1.04 |
 Guatemala Guatemala |
43,000 | 2.485 | 17,000 | 2.529 |
 Tanzania Tanzania |
39,323.15 | 0.726 | 33,247 | 1.183 |
 Moldova Moldova |
38,419 | 10.82 | 24,778 | 1.551 |
 Nepal Nepal |
36,671.61 | 1.255 | 26,842 | 1.366 |
 Rwanda Rwanda |
29,621.84 | 2.468 | 70,691 | 0.419 |
 Belize Belize |
29,101 | 73.509 | 16,591 | 1.754 |
 Bosnia and Herzegovina Bosnia and Herzegovina |
28,127 | 7.432 | 12,785 | 2.2 |
 Congo-Kinshasa Congo-Kinshasa |
27,695 | 0.34 | 50,000 | 0.554 |
 Mali Mali |
23,726 | 1.242 | 39,390 | 0.602 |
 Thailand Thailand |
20,016 | 0.289 | 12,010 | 1.667 |
 Uzbekistan Uzbekistan |
18,529.52 | 0.567 | 6,913 | 2.68 |
 Ecuador Ecuador |
13,112.2 | 0.768 | 8,665 | 1.513 |
 Nicaragua Nicaragua |
11,000 | 1.75 | 5,000 | 2.2 |
 Kenya Kenya |
10,100 | 0.198 | 11,313 | 0.893 |
 Slovenia Slovenia |
7,880 | 3.813 | 3,000 | 2.627 |
 Sri Lanka Sri Lanka |
7,780 | 0.363 | 3,986 | 1.952 |
 Spain Spain |
7,670 | 0.164 | 2,440 | 3.143 |
 Switzerland Switzerland |
6,949 | 0.818 | 3,079 | 2.257 |
 Bulgaria Bulgaria |
6,070 | 0.861 | 3,670 | 1.654 |
 Afghanistan Afghanistan |
6,000 | 0.19 | 3,000 | 2 |
 Laos Laos |
5,887.81 | 0.846 | 2,371 | 2.483 |
 Venezuela Venezuela |
5,479.68 | 0.172 | 4,113 | 1.332 |
 El Salvador El Salvador |
5,291.59 | 0.797 | 2,720 | 1.945 |
 Taiwan Taiwan |
4,194 | 0.178 | 3,376 | 1.242 |
 Gabon Gabon |
4,007.84 | 1.938 | 4,656 | 0.861 |
 Liberia Liberia |
3,374.96 | 0.77 | 7,973 | 0.423 |
 Georgia Georgia |
3,000 | 0.804 | 1,000 | 3 |
 Peru Peru |
2,714.25 | 0.087 | 1,226 | 2.214 |
 Kyrgyzstan Kyrgyzstan |
2,675 | 0.424 | 1,465 | 1.826 |
 Burundi Burundi |
2,311.13 | 0.216 | 4,966 | 0.465 |
 Honduras Honduras |
2,193.54 | 0.243 | 1,097 | 2 |
 Syria Syria |
2,133 | 0.117 | 1,217 | 1.753 |
 Lithuania Lithuania |
1,710 | 0.611 | 1,230 | 1.39 |
 Cuba Cuba |
1,000 | 0.089 | 400 | 2.5 |
 Morocco Morocco |
1,000 | 0.029 | 1,000 | 1 |
 East Timor East Timor |
853.93 | 0.677 | 927 | 0.921 |
 Greece Greece |
760 | 0.071 | 1,860 | 0.409 |
 Philippines Philippines |
615.64 | 0.006 | 339 | 1.816 |
 Côte d'Ivoire Côte d'Ivoire |
568.47 | 0.023 | 389 | 1.461 |
 Albania Albania |
519.1 | 0.181 | 181 | 2.868 |
 Panama Panama |
97.98 | 0.024 | 281 | 0.349 |
 Macedonia Macedonia |
87.54 | 0.042 | 53 | 1.652 |
 Bhutan Bhutan |
65.93 | 0.091 | 91 | 0.725 |
 Luxembourg Luxembourg |
50 | 0.083 | 30 | 1.667 |
 Madagascar Madagascar |
46.84 | 0.002 | 78 | 0.601 |
 Iraq Iraq |
34.09 | 0.001 | 39 | 0.874 |
 Azerbaijan Azerbaijan |
29.67 | 0.003 | 53 | 0.56 |
 Tajikistan Tajikistan |
20.78 | 0.002 | 63 | 0.33 |
 Pakistan Pakistan |
7 | 0 | 11 | 0.636 |
 Suriname Suriname |
3.14 | 0.006 | 3 | 1.047 |
Top Soybean Producing Countries by Share
- Brazil holds the largest share of the global production at around 41%, highlighting its agricultural prowess.
- The United States of America accounts for about 31% of global Soybean production, a testament to its extensive farming capabilities.
- Argentina contributes approximately 6.7% of the global production.
- China, with a share of about 4.4%, remains a vital player in the market.
- Canada, while producing about 7 million tonnes, captures 1.88% of the global production, indicating its steady growth in the international market.