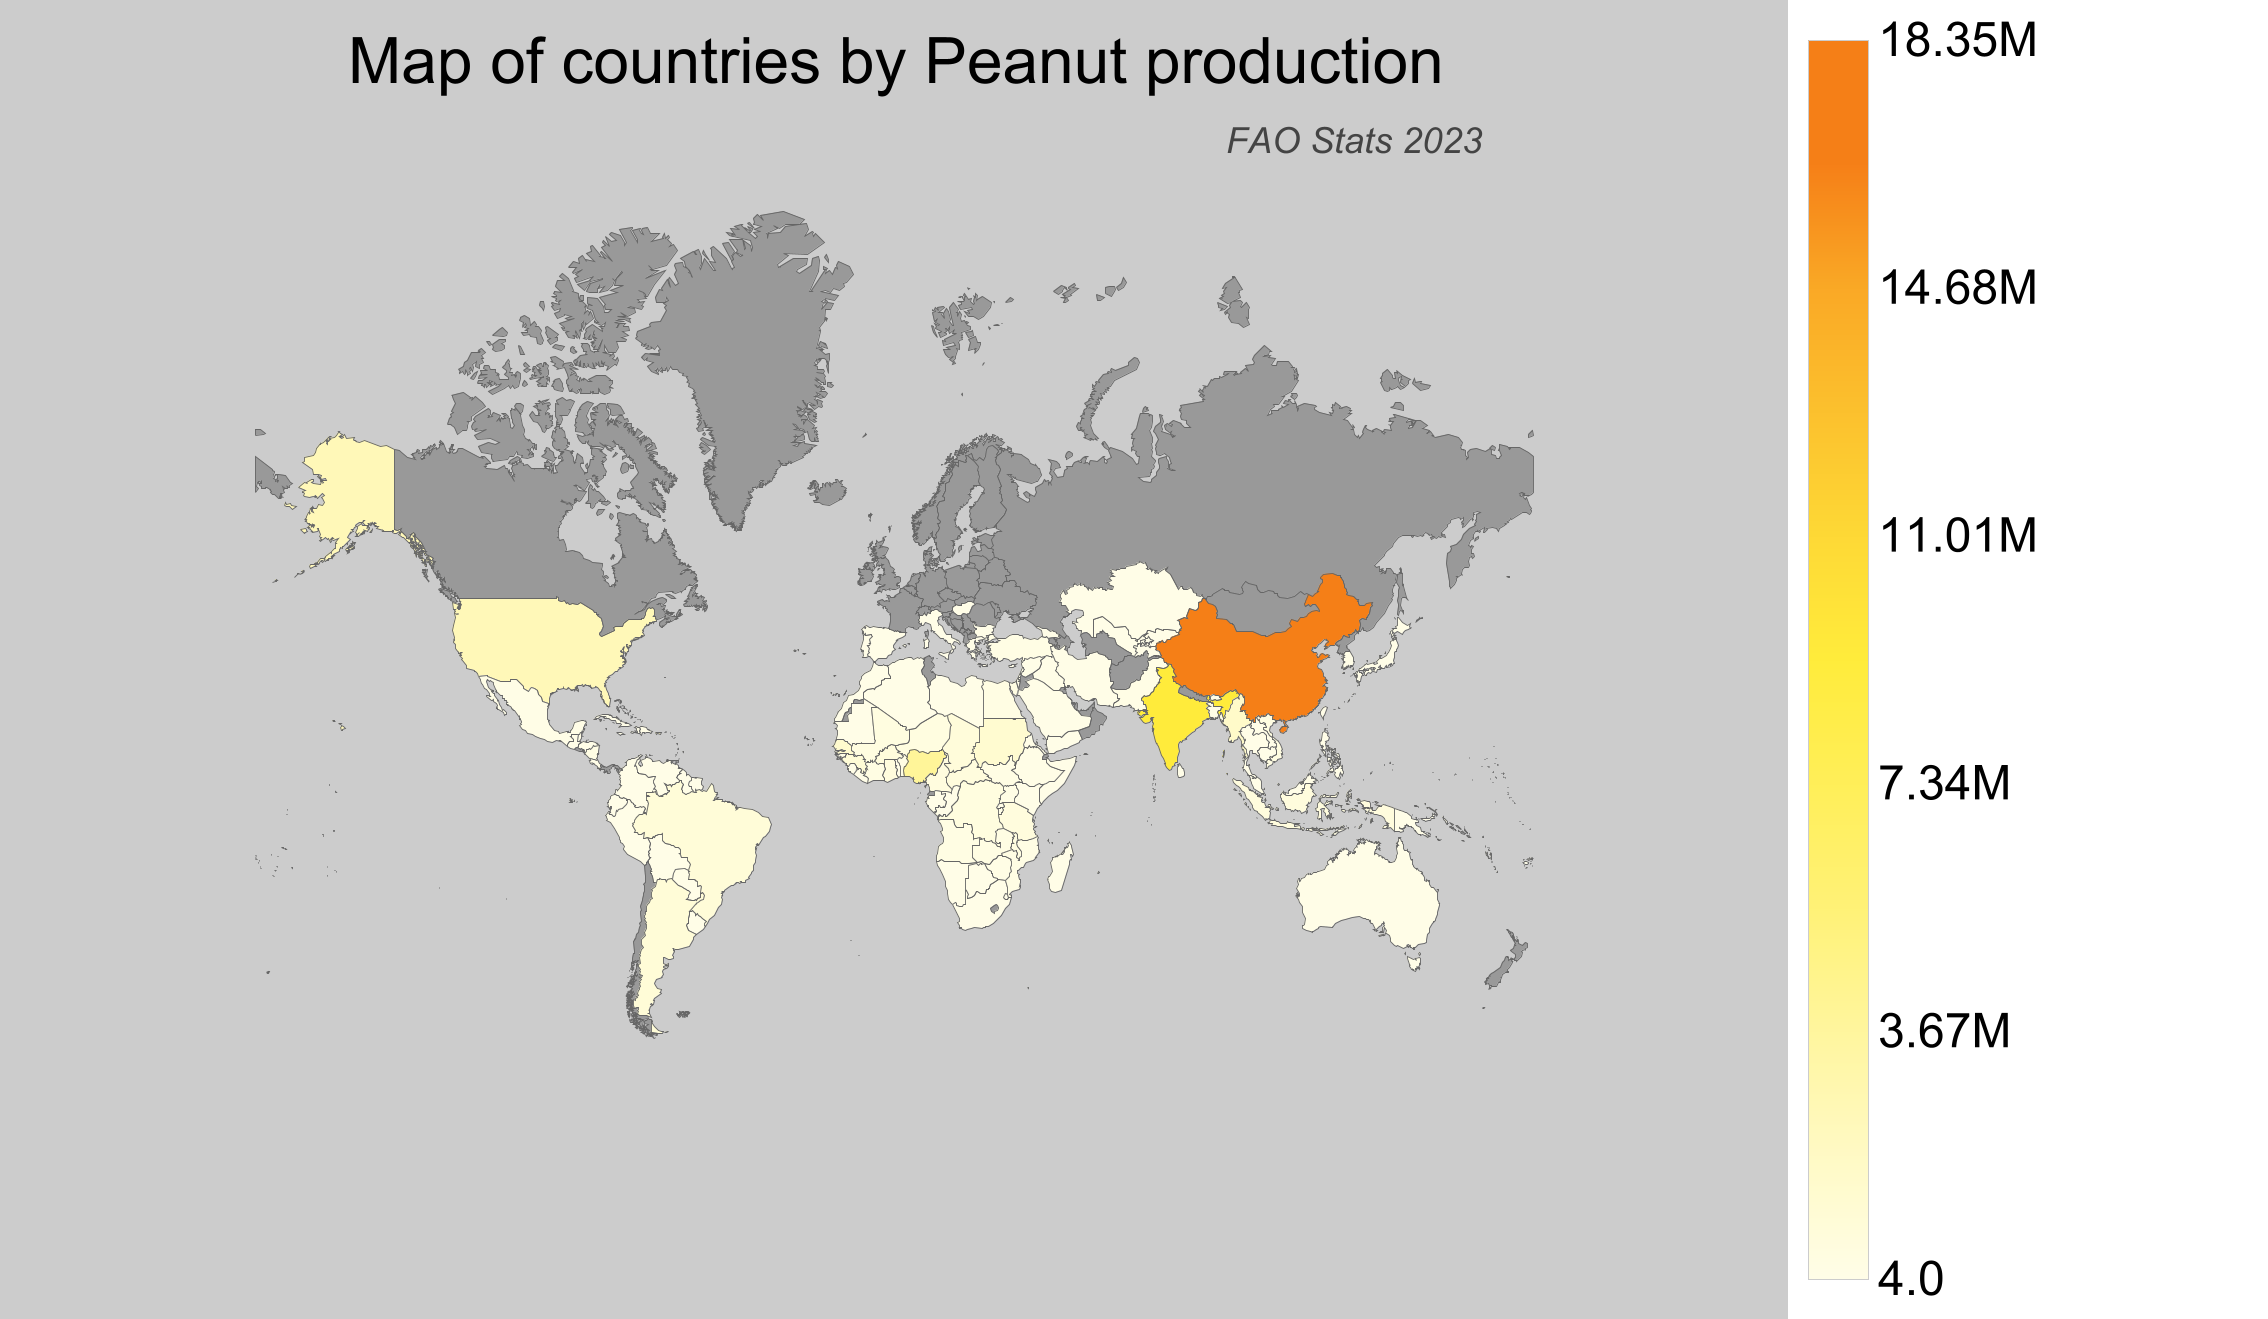
Countries by Peanut production
Peanuts are a crucial agricultural product known for their nutritional value and versatile use in various industries. They thrive in warm climates with well-drained sandy loam soils. According to the latest available data by the Food and Agriculture Organization (FAO) for the year 2023, peanut production remains an important indicator of agricultural output worldwide.
Global Peanut Production
In 2023, the global production of peanuts was approximately 54 million tonnes. Since 1961, peanut production has showcased a generally upward trend, rising from around 14 million tonnes in 1961 to 54 million tonnes in 2023. This substantial growth highlights the increasing demand and cultivation improvements over the decades.
Peanut Production by Country
- China: Approximately 18 million tonnes in 2023, leading the world's peanut production.
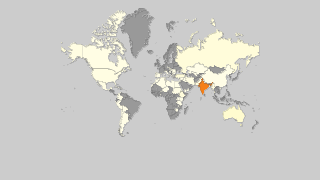
- India: Around 10 million tonnes, sustaining its position as a top producer.
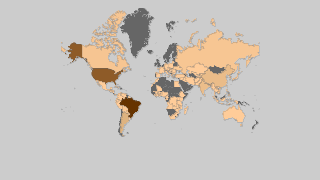
- Nigeria: Producing about 4.3 million tonnes, Nigeria remains a significant player in the peanut market.
- United States of America: With a production of around 2.7 million tonnes, the U.S. contributes sizably to global supply.
- Canada: According to FAO statistics, Canada is not a producer of peanuts.
| Country | Production (tonnes) | Production per Person (kg) | Harvested Area (ha) | Yield (kg/ha) |
|---|---|---|---|---|
 China China |
18,357,437 | 13.17 | 4,748,050 | 3.866 |
 India India |
10,296,707.97 | 7.704 | 4,961,181 | 2.075 |
 Nigeria Nigeria |
4,300,000 | 21.783 | 3,450,000 | 1.246 |
 United States of America United States of America |
2,671,670 | 8.151 | 636,980 | 4.194 |
 Myanmar Myanmar |
1,785,642.21 | 33.152 | 1,234,041 | 1.447 |
 Senegal Senegal |
1,493,090.16 | 94.944 | 1,188,774 | 1.256 |
 Sudan Sudan |
1,386,000 | 33.973 | 3,014,000 | 0.46 |
 Guinea Guinea |
1,000,000 | 84.15 | 900,000 | 1.111 |
 Argentina Argentina |
962,674 | 21.636 | 371,627 | 2.59 |
 Brazil Brazil |
875,205 | 4.177 | 235,687 | 3.713 |
 Chad Chad |
782,177 | 50.946 | 749,372 | 1.044 |
 Burkina Faso Burkina Faso |
683,183.07 | 33.747 | 754,457 | 0.906 |
 Indonesia Indonesia |
640,000 | 2.415 | 273,953 | 2.336 |
 Ghana Ghana |
600,000 | 20.26 | 370,000 | 1.622 |
 Central African Republic Central African Republic |
591,669 | 124.893 | 198,811 | 2.976 |
 Tanzania Tanzania |
586,216 | 10.816 | 669,260 | 0.876 |
 Cameroon Cameroon |
540,000 | 22.695 | 540,000 | 1 |
 Congo-Kinshasa Congo-Kinshasa |
497,197 | 6.113 | 510,000 | 0.975 |
 Niger Niger |
455,000 | 21.195 | 1,020,000 | 0.446 |
 Mali Mali |
454,736 | 23.799 | 494,789 | 0.919 |
 Vietnam Vietnam |
400,172.26 | 4.227 | 152,388 | 2.626 |
 Malawi Malawi |
350,000 | 19.519 | 400,000 | 0.875 |
 Egypt Egypt |
247,686.94 | 2.54 | 70,000 | 3.538 |
 Côte d'Ivoire Côte d'Ivoire |
240,000 | 9.636 | 165,000 | 1.455 |
 Zambia Zambia |
235,445.58 | 13.942 | 325,576 | 0.723 |
 Angola Angola |
233,483 | 7.982 | 361,101 | 0.647 |
 Mozambique Mozambique |
226,497.85 | 7.848 | 575,792 | 0.393 |
 Nicaragua Nicaragua |
206,867.5 | 32.916 | 50,166 | 4.124 |
 South Sudan South Sudan |
189,627.86 | 15.388 | 267,236 | 0.71 |
 Turkey Turkey |
185,137 | 2.169 | 46,010 | 4.024 |
 Benin Benin |
178,953.7 | 15.75 | 242,694 | 0.737 |
 Zimbabwe Zimbabwe |
160,549.8 | 10.812 | 369,772 | 0.434 |
 Guinea-Bissau Guinea-Bissau |
143,817.84 | 90.75 | 121,249 | 1.186 |
 Uganda Uganda |
140,000 | 3.606 | 330,000 | 0.424 |
 Pakistan Pakistan |
120,937 | 0.599 | 142,864 | 0.847 |
 Ethiopia Ethiopia |
115,000 | 1.069 | 90,000 | 1.278 |
 Mexico Mexico |
91,208.62 | 0.731 | 45,632 | 1.999 |
 Sierra Leone Sierra Leone |
88,608.12 | 11.478 | 66,343 | 1.336 |
 Bangladesh Bangladesh |
67,173 | 0.407 | 35,526 | 1.891 |
 Madagascar Madagascar |
56,205.56 | 2.14 | 63,332 | 0.887 |
 Gambia Gambia |
55,000 | 26.811 | 55,000 | 1 |
 South Africa South Africa |
53,000 | 0.918 | 31,300 | 1.693 |
 Taiwan Taiwan |
49,637 | 2.105 | 18,050 | 2.75 |
 Togo Togo |
45,208.36 | 6.149 | 59,903 | 0.755 |
 Laos Laos |
43,563.45 | 6.258 | 16,308 | 2.671 |
 Gabon Gabon |
32,592.59 | 15.764 | 31,549 | 1.033 |
 Philippines Philippines |
31,772.15 | 0.299 | 25,039 | 1.269 |
 Sri Lanka Sri Lanka |
29,680 | 1.384 | 16,597 | 1.788 |
 Congo-Brazzaville Congo-Brazzaville |
26,573.43 | 4.921 | 49,820 | 0.533 |
 Bolivia Bolivia |
26,448.21 | 2.339 | 19,172 | 1.38 |
 Thailand Thailand |
26,019 | 0.376 | 11,285 | 2.306 |
 Kenya Kenya |
24,000 | 0.471 | 20,924 | 1.147 |
 Morocco Morocco |
22,224 | 0.639 | 8,250 | 2.694 |
 Syria Syria |
19,721 | 1.079 | 6,106 | 3.23 |
 Algeria Algeria |
18,252.77 | 0.429 | 5,754 | 3.172 |
 Paraguay Paraguay |
16,782 | 2.379 | 17,272 | 0.972 |
 Uzbekistan Uzbekistan |
16,497.06 | 0.505 | 1,063 | 15.519 |
 Australia Australia |
16,347.28 | 0.653 | 5,100 | 3.205 |
 Tajikistan Tajikistan |
15,851.84 | 1.775 | 3,619 | 4.38 |
 Japan Japan |
15,700 | 0.124 | 5,710 | 2.75 |
 Libya Libya |
14,422.81 | 2.229 | 8,978 | 1.606 |
 Israel Israel |
13,721 | 1.54 | 3,000 | 4.574 |
 Rwanda Rwanda |
13,195.73 | 1.1 | 28,936 | 0.456 |
 Haiti Haiti |
13,100 | 1.179 | 40,100 | 0.327 |
 Iran Iran |
12,245.17 | 0.15 | 2,595 | 4.719 |
 Cambodia Cambodia |
12,000 | 0.747 | 10,000 | 1.2 |
 Burundi Burundi |
10,602.19 | 0.993 | 16,367 | 0.648 |
 Guatemala Guatemala |
10,290.33 | 0.595 | 2,141 | 4.806 |
 South Korea South Korea |
9,000 | 0.174 | 3,306 | 2.722 |
 Somalia Somalia |
8,369.68 | 0.551 | 7,753 | 1.08 |
 Lebanon Lebanon |
7,573 | 1.243 | 1,634 | 4.635 |
 Dominican Republic Dominican Republic |
7,203.38 | 0.702 | 4,535 | 1.588 |
 Liberia Liberia |
6,805.6 | 1.553 | 8,183 | 0.832 |
 Iraq Iraq |
6,719 | 0.171 | 1,832 | 3.668 |
 Peru Peru |
5,868.78 | 0.188 | 3,938 | 1.49 |
 Comoros Comoros |
4,847.17 | 5.698 | 5,518 | 0.878 |
 Greece Greece |
4,567 | 0.424 | 1,478 | 3.09 |
 East Timor East Timor |
3,488.1 | 2.765 | 5,388 | 0.647 |
 Venezuela Venezuela |
3,020.75 | 0.095 | 956 | 3.16 |
 Ecuador Ecuador |
2,609.92 | 0.153 | 3,447 | 0.757 |
 Colombia Colombia |
2,447.35 | 0.049 | 1,698 | 1.441 |
 Eritrea Eritrea |
2,261.95 | 0.436 | 3,042 | 0.744 |
 Swaziland Swaziland |
2,215.24 | 1.911 | 4,944 | 0.448 |
 Saudi Arabia Saudi Arabia |
2,017.03 | 0.06 | 484 | 4.167 |
 Jamaica Jamaica |
2,011 | 0.737 | 1,611 | 1.248 |
 Uruguay Uruguay |
1,847.94 | 0.527 | 3,432 | 0.538 |
 Vanuatu Vanuatu |
1,614.46 | 5.302 | 1,396 | 1.156 |
 Papua New Guinea Papua New Guinea |
1,546.75 | 0.181 | 1,480 | 1.045 |
 Yemen Yemen |
1,462.35 | 0.051 | 2,015 | 0.726 |
 Tonga Tonga |
1,255.42 | 12.473 | 2,035 | 0.617 |
 Mauritania Mauritania |
825.12 | 0.207 | 1,031 | 0.8 |
 Bulgaria Bulgaria |
751 | 0.107 | 443 | 1.695 |
 Spain Spain |
661 | 0.014 | 228 | 2.899 |
 Kyrgyzstan Kyrgyzstan |
652 | 0.103 | 197 | 3.31 |
 Botswana Botswana |
406.24 | 0.176 | 1,621 | 0.251 |
 Namibia Namibia |
374.79 | 0.155 | 1,074 | 0.349 |
 Fiji Fiji |
355.45 | 0.402 | 428 | 0.83 |
 Cyprus Cyprus |
350 | 0.409 | 80 | 4.375 |
 Mauritius Mauritius |
348 | 0.275 | 151 | 2.305 |
 Belize Belize |
291 | 0.735 | 306 | 0.951 |
 Guyana Guyana |
247.88 | 0.317 | 16 | 15.492 |
 Costa Rica Costa Rica |
226.72 | 0.045 | 208 | 1.09 |
 Georgia Georgia |
224.17 | 0.06 | 239 | 0.938 |
 Cuba Cuba |
149.7 | 0.013 | 144 | 1.04 |
 Malaysia Malaysia |
137.5 | 0.004 | 51 | 2.696 |
 Saint Vincent and the Grenadines Saint Vincent and the Grenadines |
124 | 1.132 | 36 | 3.444 |
 Bhutan Bhutan |
120.7 | 0.166 | 80 | 1.509 |
 Honduras Honduras |
81.73 | 0.009 | 152 | 0.538 |
 Italy Italy |
65 | 0.001 | 17 | 3.824 |
 Suriname Suriname |
52.34 | 0.092 | 17 | 3.079 |
 Portugal Portugal |
30 | 0.003 | 12 | 2.5 |
 Kazakhstan Kazakhstan |
15.97 | 0.001 | 23 | 0.694 |
 Saint Kitts and Nevis Saint Kitts and Nevis |
14.97 | 0.324 | 10 | 1.497 |
 Palestinian Territories Palestinian Territories |
10.06 | 0.002 | 2 | 5.03 |
 Barbados Barbados |
7.38 | 0.026 | 4 | 1.845 |
 Hungary Hungary |
4 | 0 | 6 | 0.667 |
Top Peanut Producing Countries by Share
- China: Holding approximately 34% of the global production, China dominates the peanut market.
- India: With nearly 19% contribution, India ranks as the second largest producer.
- Nigeria: Nigeria's 8% share signifies its growing impact in the industry.
- United States of America: The U.S. accounts for about 5% of the global production.
- These four countries combined contribute a substantial portion of the world's peanut production, with China leading by a large margin.