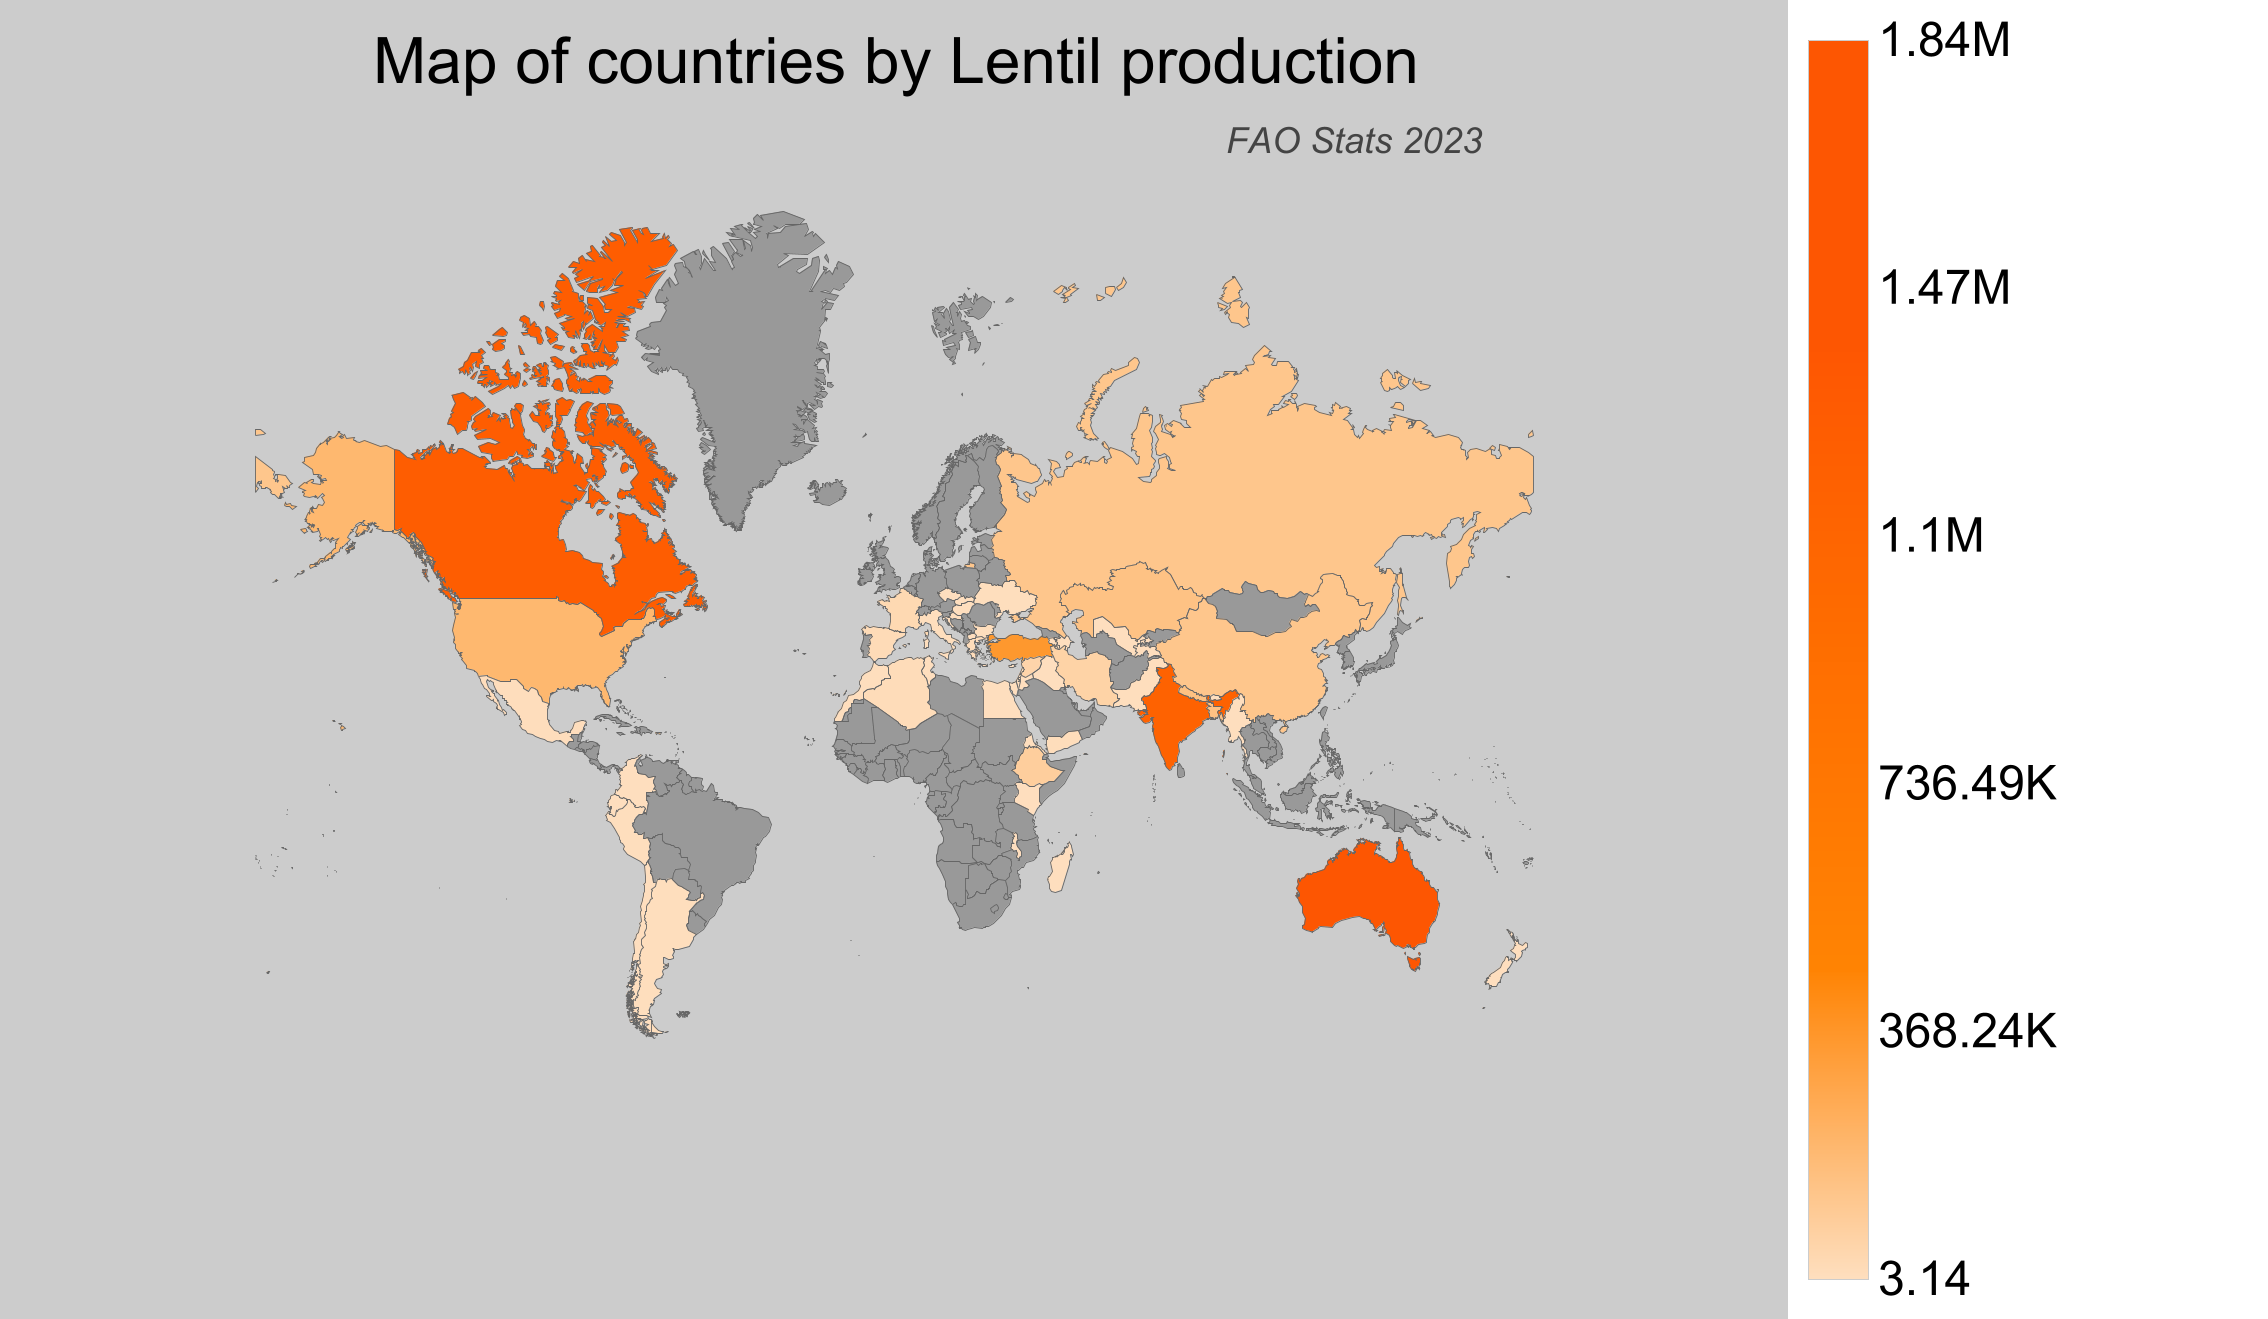
Countries by Lentil production
Lentils are a vital source of protein and dietary fiber, making them an essential part of diets worldwide. They thrive in temperate climates with well-drained soil, typically found in regions with moderate rainfall and cool seasons. Lentils contribute significantly to food security and agriculture in many parts of the world. This data, extracted from the Food and Agriculture Organization (FAO) stats database for 2023, provides insights into global lentil production.
Global Lentil Production
In 2023, global lentil production reached approximately 7.1 million tonnes, reflecting a steady increase from the 854,877 tonnes produced in 1961. Noteworthy was the production surge in the late 20th century, with significant growth beyond the 1990s. The most recent figures show a nearly ninefold increase since 1961, emphasizing the growing importance of lentils in global agriculture.
Lentil Production by Country
- Australia produced around 1.84 million tonnes of lentils, making it the top producer in 2023.
- Canada, renowned for its high-quality lentils, generated approximately 1.67 million tonnes.
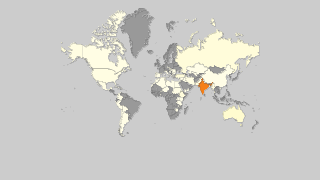
- India followed closely with a production of about 1.56 million tonnes.
- Turkey also contributed significantly with 474,000 tonnes of production.
| Country | Production (tonnes) | Production per Person (kg) | Harvested Area (ha) | Yield (kg/ha) |
|---|---|---|---|---|
 Australia Australia |
1,841,222 | 73.504 | 873,264 | 2.108 |
 Canada Canada |
1,671,072 | 44.905 | 1,460,300 | 1.144 |
 India India |
1,558,636.62 | 1.166 | 1,636,781 | 0.952 |
 Turkey Turkey |
474,000 | 5.552 | 322,930 | 1.468 |
 United States of America United States of America |
260,450 | 0.795 | 211,650 | 1.231 |
 Nepal Nepal |
200,787.01 | 6.872 | 173,011 | 1.161 |
 Bangladesh Bangladesh |
196,829 | 1.192 | 135,396 | 1.454 |
 Kazakhstan Kazakhstan |
192,884.5 | 10.556 | 225,181 | 0.857 |
 Russian Federation Russian Federation |
166,550.48 | 1.134 | 161,174 | 1.033 |
 China China |
165,158.18 | 0.118 | 65,047 | 2.539 |
 Ethiopia Ethiopia |
108,926.5 | 1.013 | 77,425 | 1.407 |
 Iran Iran |
79,654.4 | 0.974 | 131,912 | 0.604 |
 Syria Syria |
67,946 | 3.716 | 81,555 | 0.833 |
 France France |
39,994 | 0.594 | 31,045 | 1.288 |
 Spain Spain |
24,357 | 0.522 | 36,504 | 0.667 |
 Algeria Algeria |
16,703.33 | 0.393 | 16,612 | 1.005 |
 Greece Greece |
13,837.61 | 1.285 | 12,307 | 1.124 |
 Yemen Yemen |
9,867.85 | 0.341 | 10,869 | 0.908 |
 Mexico Mexico |
8,408.25 | 0.067 | 7,514 | 1.119 |
 Ukraine Ukraine |
6,370 | 0.151 | 5,200 | 1.225 |
 Argentina Argentina |
6,246 | 0.14 | 14,426 | 0.433 |
 Morocco Morocco |
5,968.41 | 0.172 | 28,680 | 0.208 |
 Bulgaria Bulgaria |
5,920 | 0.84 | 4,471 | 1.324 |
 Pakistan Pakistan |
4,668 | 0.023 | 7,428 | 0.628 |
 Peru Peru |
4,030.05 | 0.129 | 4,248 | 0.949 |
 Italy Italy |
3,663 | 0.061 | 4,981 | 0.735 |
 Ecuador Ecuador |
2,790.91 | 0.164 | 3,705 | 0.753 |
 Tunisia Tunisia |
1,728.78 | 0.151 | 3,449 | 0.501 |
 New Zealand New Zealand |
1,663.74 | 0.339 | 674 | 2.468 |
 Kenya Kenya |
1,657.15 | 0.033 | 2,101 | 0.789 |
 Lebanon Lebanon |
1,341.46 | 0.22 | 1,056 | 1.27 |
 Colombia Colombia |
1,334.7 | 0.027 | 4,542 | 0.294 |
 Malawi Malawi |
1,200.66 | 0.067 | 2,074 | 0.579 |
 Tajikistan Tajikistan |
1,036.5 | 0.116 | 499 | 2.077 |
 Uzbekistan Uzbekistan |
1,023.44 | 0.031 | 1,090 | 0.939 |
 Palestinian Territories Palestinian Territories |
883.61 | 0.194 | 599 | 1.475 |
 Madagascar Madagascar |
867.07 | 0.033 | 1,263 | 0.687 |
 Myanmar Myanmar |
670.02 | 0.012 | 983 | 0.682 |
 Slovakia Slovakia |
597 | 0.11 | 509 | 1.173 |
 Azerbaijan Azerbaijan |
575.7 | 0.058 | 404 | 1.425 |
 Jordan Jordan |
512 | 0.05 | 455 | 1.125 |
 Egypt Egypt |
470.16 | 0.005 | 198 | 2.375 |
 Chile Chile |
183.52 | 0.01 | 811 | 0.226 |
 Eritrea Eritrea |
139.11 | 0.027 | 527 | 0.264 |
 Armenia Armenia |
138.6 | 0.047 | 117 | 1.185 |
 Macedonia Macedonia |
50 | 0.024 | 46 | 1.087 |
 Croatia Croatia |
46.4 | 0.011 | 22 | 2.109 |
 Israel Israel |
25 | 0.003 | 115 | 0.217 |
 Hungary Hungary |
20 | 0.002 | 24 | 0.833 |
 Cyprus Cyprus |
10 | 0.012 | 19 | 0.526 |
 Iraq Iraq |
6.25 | 0 | 6 | 1.042 |
 Bhutan Bhutan |
4.06 | 0.006 | 7 | 0.58 |
 Czech Republic Czech Republic |
3.14 | 0 | 11 | 0.285 |
Top Lentil Producing Countries by Share
- Australia accounted for approximately 26% of the global lentil production in 2023, highlighting its leadership.
- Canada, a major player in the lentil market, represented nearly 24% of the world's production.
- India's share stood at 22%, showcasing its substantial contribution.
- Turkey contributed around 6.7%, adding to the diverse landscape of lentil producers.