Countries by Hazelnut production
Hazelnuts are an essential component of many culinary traditions worldwide, prized for their rich flavor and nutritional benefits. These nuts typically grow in temperate climates where there is a moderate amount of rainfall. As of 2025, the latest available data from the Food and Agriculture Organization (FAO) indicates that Hazelnut production data for the year 2023 provides valuable insights into global agricultural trends.
Global Hazelnut Production
In 2023, the global Hazelnut production reached approximately 1.1 million tonnes. Over the years, production has seen a significant upward trend, rising from around 182,000 tonnes in 1961 to over 1 million tonnes. This marks a substantial increase, showcasing the growing demand and cultivation of Hazelnuts worldwide.
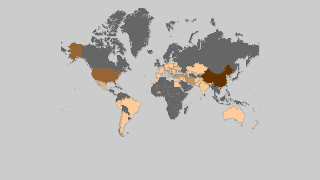
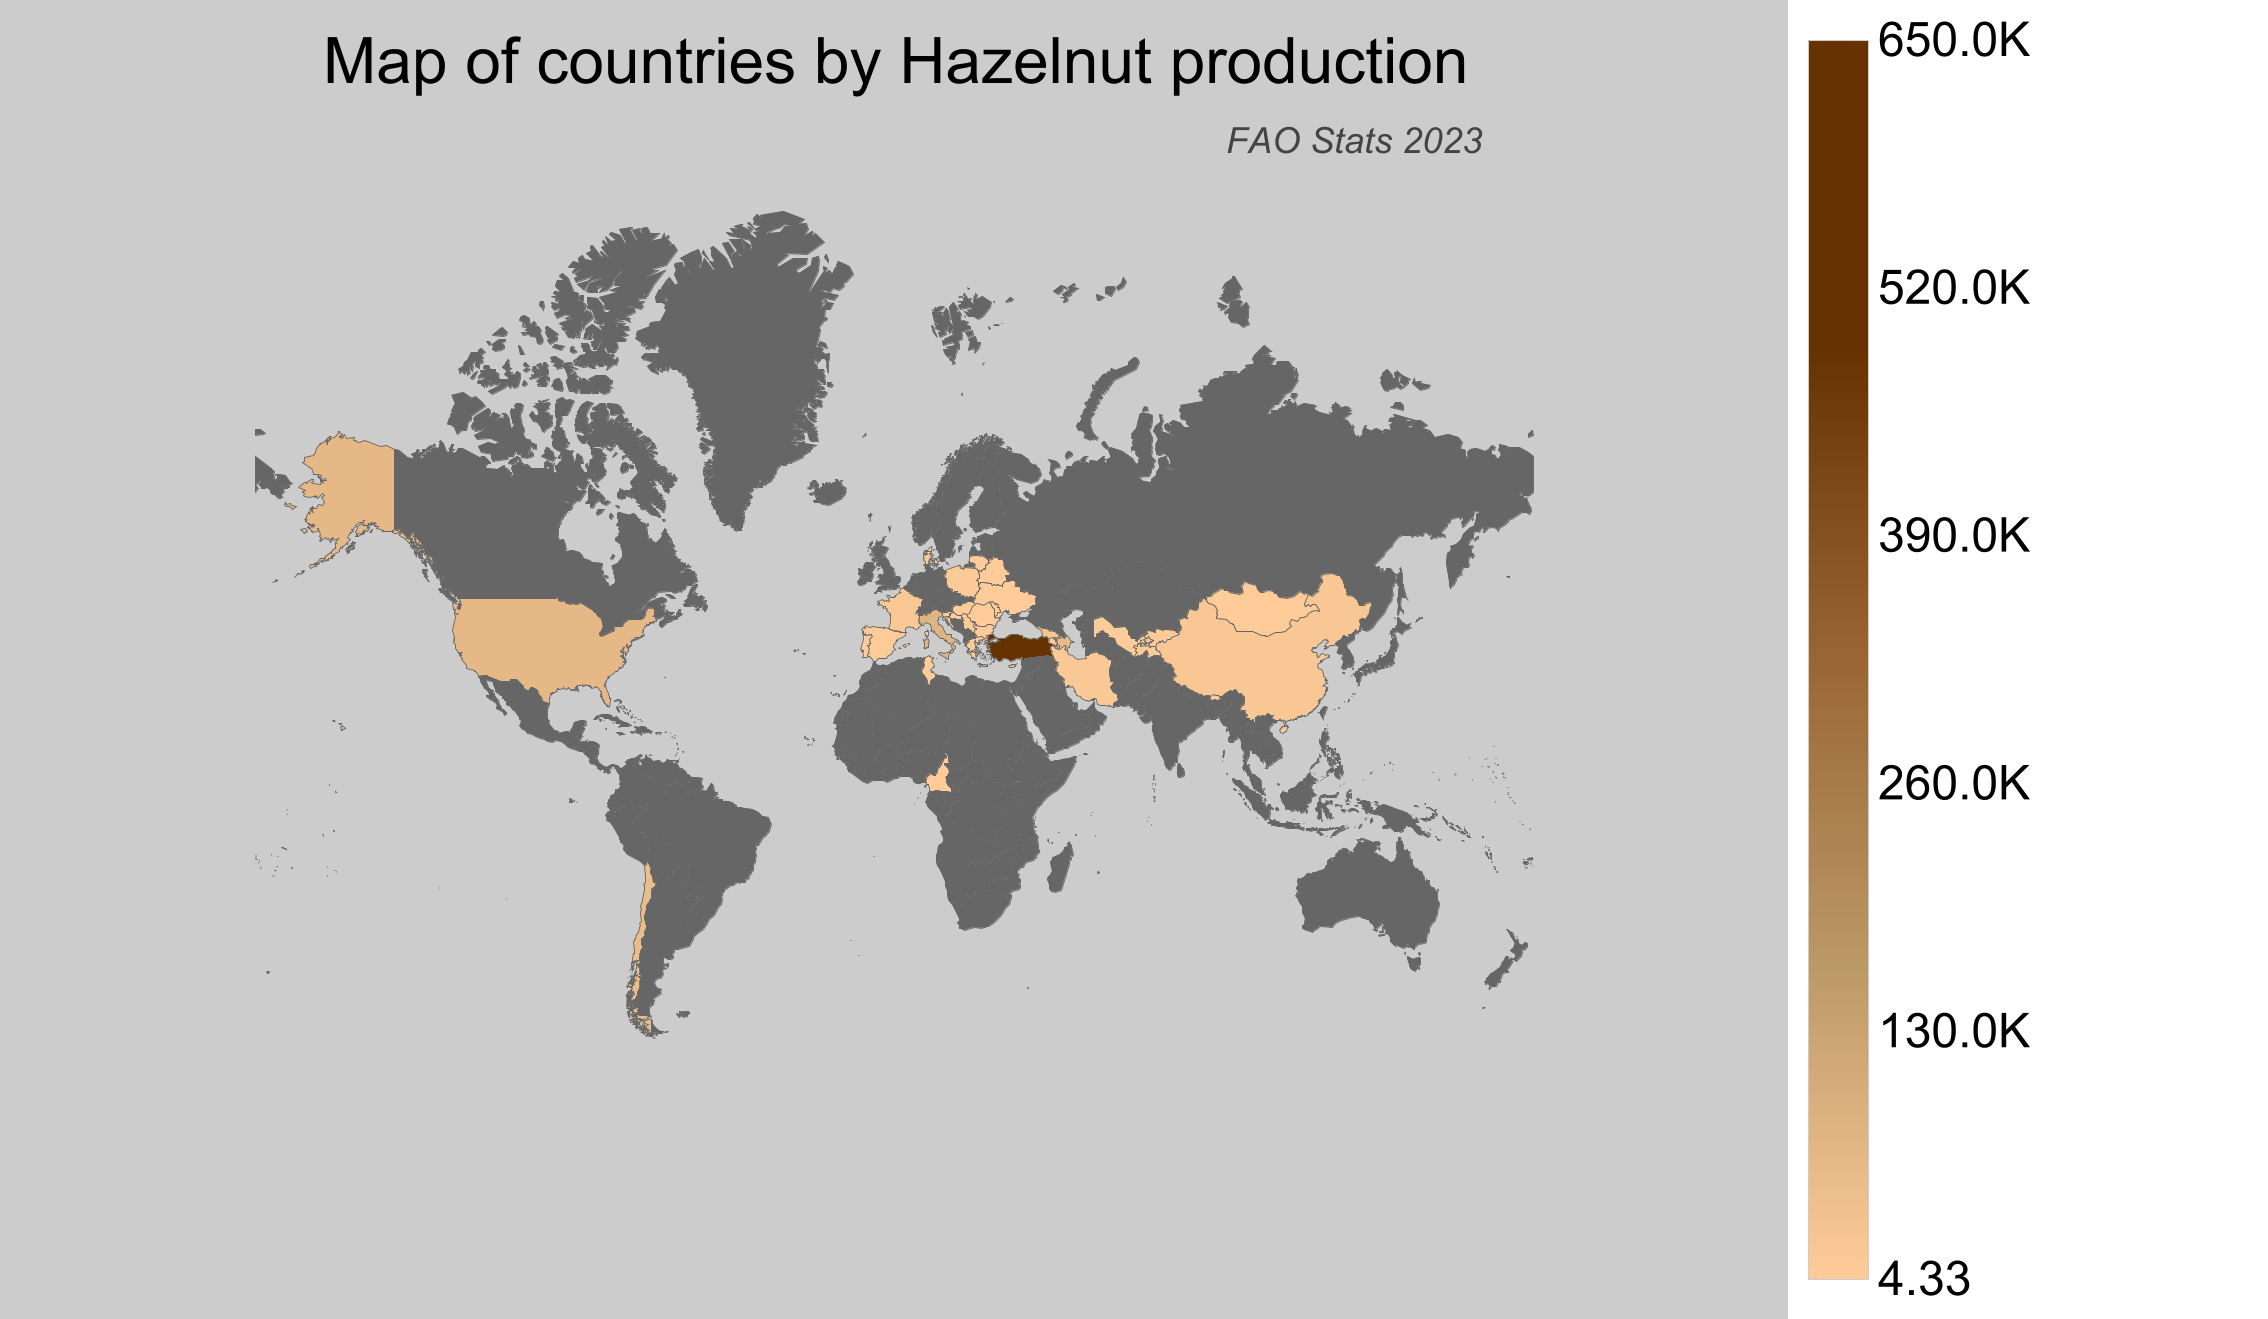
Hazelnut Production by Country
- Turkey leads the world in Hazelnut production with a whopping output of around 650,000 tonnes in 2023.
- Italy is the second-largest producer, contributing approximately 103,000 tonnes.
- The United States of America also plays a vital role, producing around 85,000 tonnes.
- Azerbaijan follows closely with a production level of about 75,000 tonnes.
- According to FAO stats, Canada does not produce Hazelnuts.
| Country | Production (tonnes) | Production per Person (kg) | Harvested Area (ha) | Yield (kg/ha) |
|---|---|---|---|---|
 Turkey Turkey |
650,000 | 7.614 | 746,749 | 0.87 |
 Italy Italy |
102,740 | 1.7 | 87,500 | 1.174 |
 United States of America United States of America |
85,460 | 0.261 | 30,756 | 2.779 |
 Azerbaijan Azerbaijan |
75,409.3 | 7.619 | 53,942 | 1.398 |
 Chile Chile |
65,646.73 | 3.735 | 36,375 | 1.805 |
 Georgia Georgia |
36,900 | 9.894 | 20,449 | 1.804 |
 China China |
24,422.53 | 0.018 | 12,538 | 1.948 |
 France France |
17,160 | 0.255 | 7,920 | 2.167 |
 Iran Iran |
13,601.77 | 0.166 | 26,212 | 0.519 |
 Poland Poland |
10,700 | 0.278 | 5,600 | 1.911 |
 Serbia Serbia |
10,190.11 | 1.455 | 8,592 | 1.186 |
 Greece Greece |
6,950 | 0.645 | 750 | 9.267 |
 Spain Spain |
6,790 | 0.146 | 12,470 | 0.545 |
 Kyrgyzstan Kyrgyzstan |
4,276.52 | 0.678 | 6,455 | 0.663 |
 Uzbekistan Uzbekistan |
3,743.39 | 0.115 | 3,039 | 1.232 |
 Croatia Croatia |
2,450 | 0.584 | 8,700 | 0.282 |
 Romania Romania |
2,160 | 0.111 | 1,540 | 1.403 |
 Belarus Belarus |
1,238.13 | 0.131 | 1,819 | 0.681 |
 Tajikistan Tajikistan |
996.95 | 0.112 | 810 | 1.231 |
 Bulgaria Bulgaria |
800 | 0.113 | 1,720 | 0.465 |
 Ukraine Ukraine |
790 | 0.019 | 700 | 1.129 |
 Armenia Armenia |
445.4 | 0.15 | 182 | 2.447 |
 Hungary Hungary |
390 | 0.04 | 540 | 0.722 |
 Moldova Moldova |
351.67 | 0.099 | 547 | 0.643 |
 Mongolia Mongolia |
339.4 | 0.105 | 371 | 0.915 |
 Portugal Portugal |
250 | 0.024 | 700 | 0.357 |
 Slovenia Slovenia |
250 | 0.121 | 210 | 1.19 |
 Lithuania Lithuania |
200 | 0.071 | 300 | 0.667 |
 Cameroon Cameroon |
160.66 | 0.007 | 148 | 1.086 |
 Tunisia Tunisia |
46.5 | 0.004 | 50 | 0.93 |
 Cyprus Cyprus |
20 | 0.023 | 30 | 0.667 |
 Bhutan Bhutan |
14.06 | 0.019 | 43 | 0.327 |
 Denmark Denmark |
4.33 | 0.001 | 5 | 0.866 |
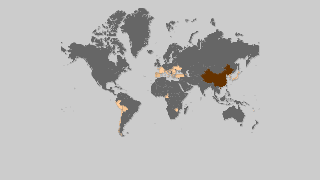
Top Hazelnut Producing Countries by Share
- Turkey dominates global Hazelnut production, accounting for over 57% of the total output in 2023, making it the undisputed leader.
- Italy, with a production share of about 9.1%, is a significant contributor to the global market.
- The United States of America's production represents around 7.6% of the global share.
- Azerbaijan contributes approximately 6.7% to the world's Hazelnut production.
- Canada is not listed by FAO as a Hazelnut producer.