Countries by Chestnut production
Chestnuts are a valuable agricultural product grown in temperate climates. This nut is known for its nutritional benefits and plays a significant role in various cultural cuisines, especially during the autumn and winter seasons. The tree thrives in regions with mild climates and well-drained soil. This report focuses on the chestnut production statistics for the year 2023, based on the latest available data from the Food and Agriculture Organization (FAO) as of 2025.
Global Chestnut Production
In 2023, the global chestnut production reached around 2.1 million tonnes. Over the years, chestnut production has seen significant growth, starting from approximately 594,000 tonnes in 1961 to just over 2.1 million tonnes recently. This marks a substantial increase of around 250% over this period. The production faced fluctuations throughout the decades, but the general trend has been upward, especially noticeable from the late 1990s onward.
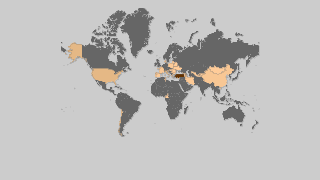
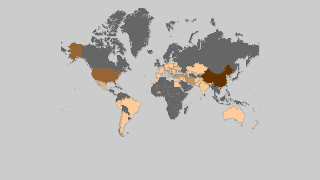
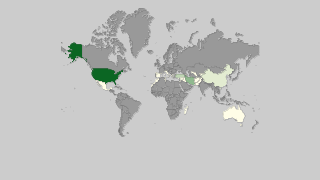
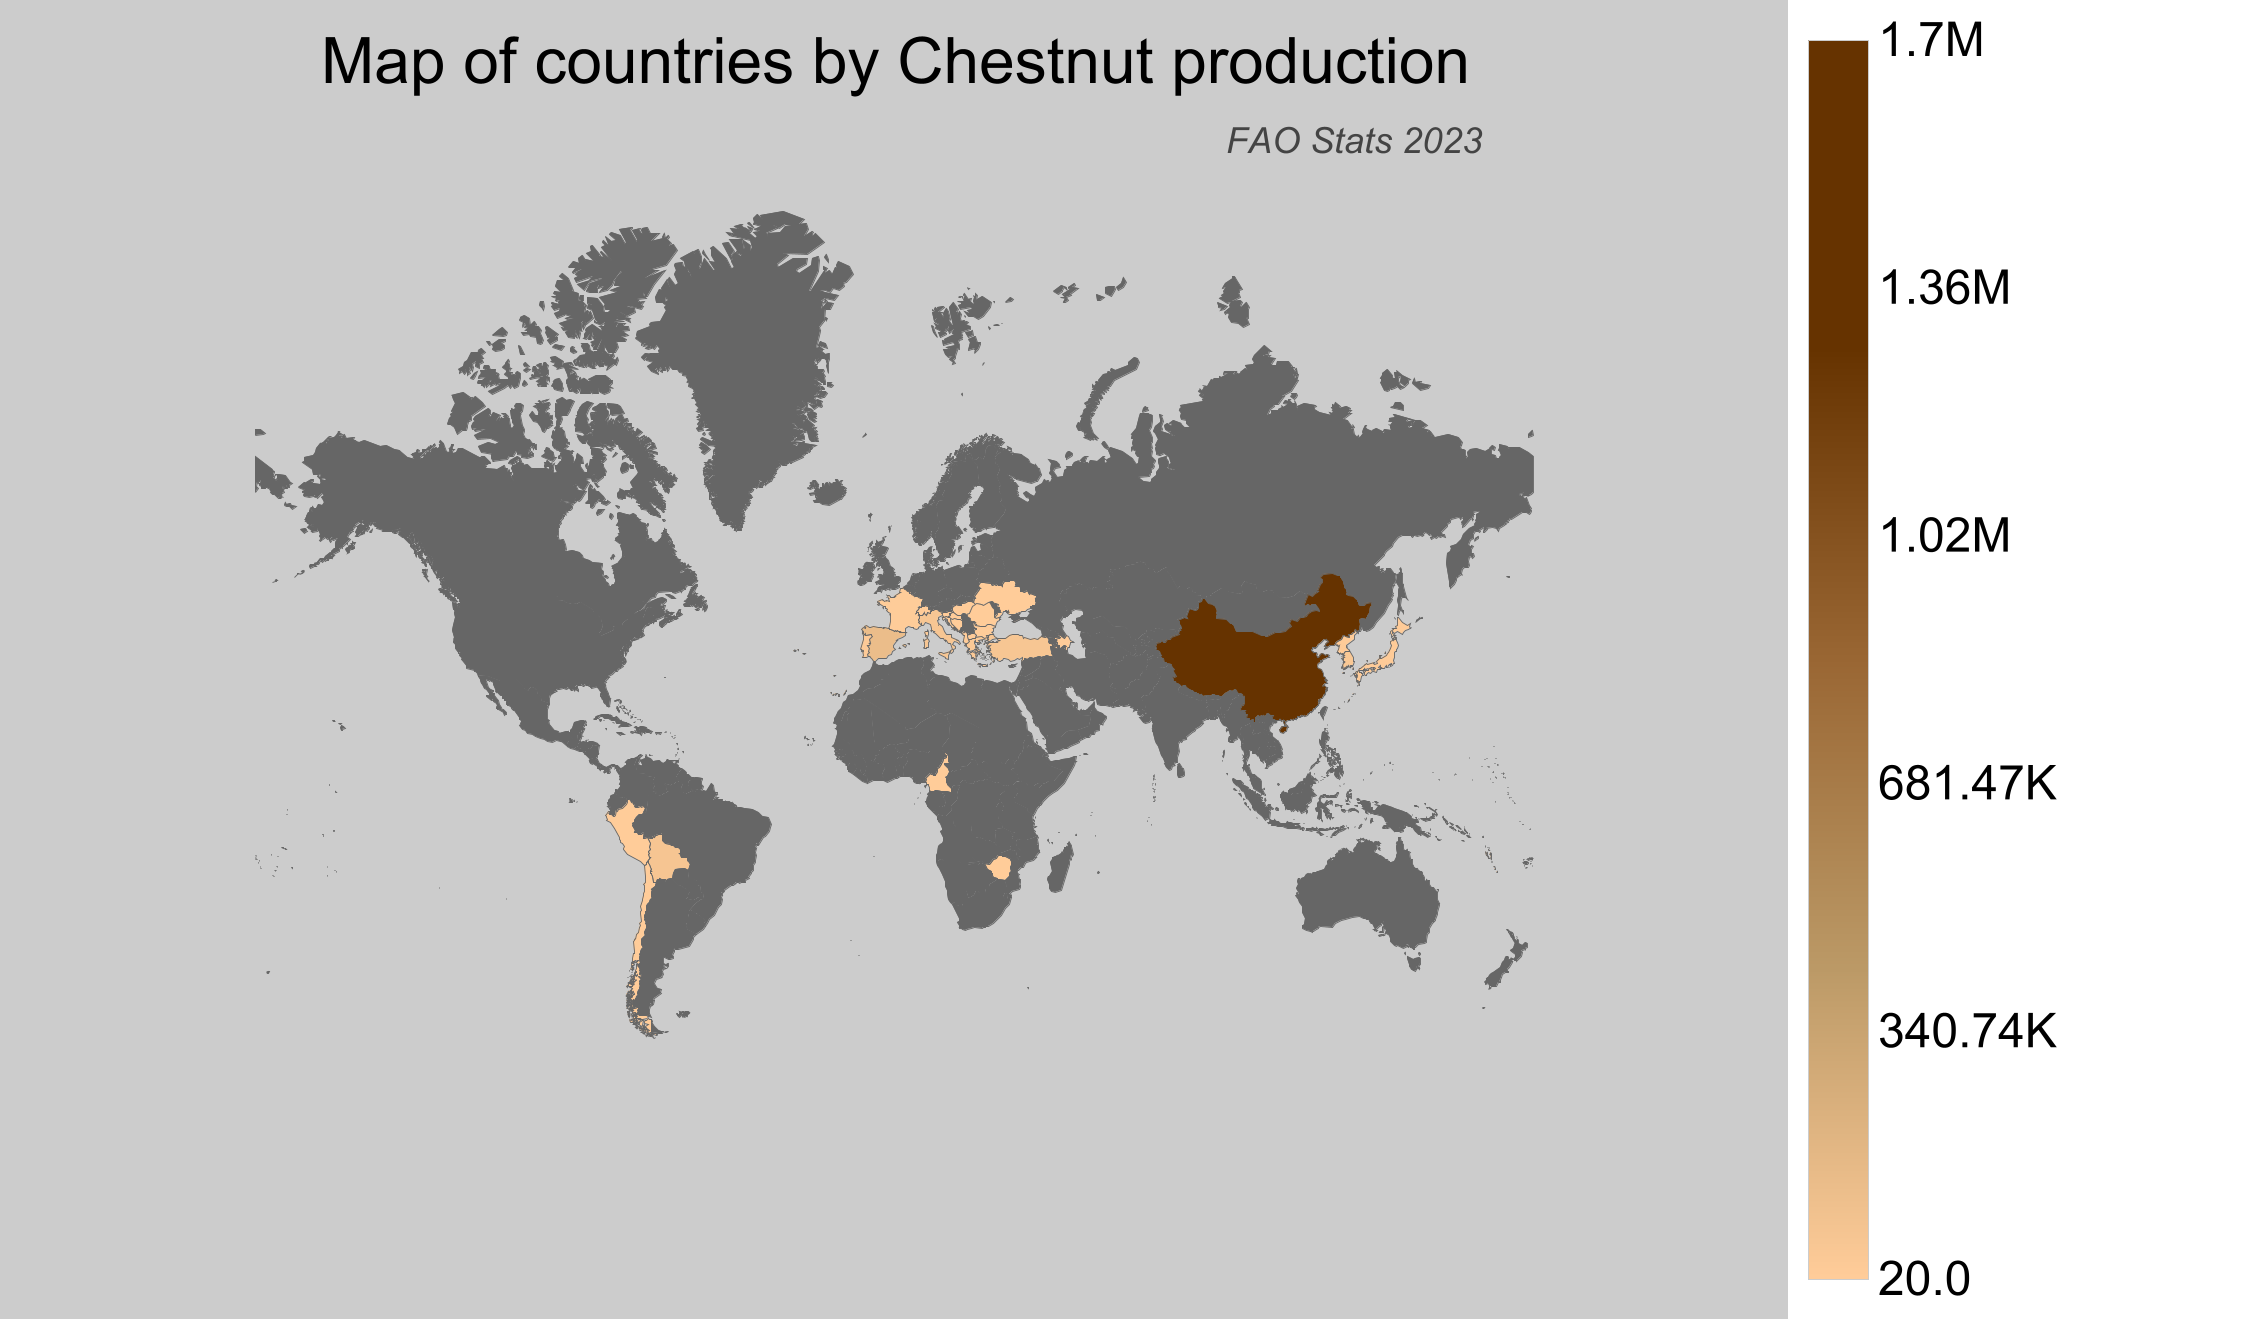
Chestnut Production by Country
- China is the leading producer of chestnuts, with a staggering production volume of around 1.7 million tonnes.
- Spain follows with a notable chestnut production of approximately 174,000 tonnes.
- Bolivia ranks as a key player, contributing about 83,000 tonnes to the global market.
- Turkey has a significant production of around 71,000 tonnes.
- According to FAO statistics, Canada is not listed as a chestnut producer.
| Country | Production (tonnes) | Production per Person (kg) | Harvested Area (ha) | Yield (kg/ha) |
|---|---|---|---|---|
 China China |
1,703,652.67 | 1.222 | 295,661 | 5.762 |
 Spain Spain |
174,090 | 3.731 | 38,520 | 4.519 |
 Bolivia Bolivia |
82,962.36 | 7.337 | 57,944 | 1.432 |
 Turkey Turkey |
71,156 | 0.833 | 13,992 | 5.085 |
 Italy Italy |
70,370 | 1.164 | 40,750 | 1.727 |
 South Korea South Korea |
52,779.07 | 1.022 | 31,325 | 1.685 |
 Greece Greece |
34,900 | 3.241 | 9,110 | 3.831 |
 Portugal Portugal |
23,830 | 2.316 | 50,590 | 0.471 |
 Japan Japan |
15,000 | 0.119 | 15,800 | 0.949 |
 North Korea North Korea |
12,781.43 | 0.499 | 5,279 | 2.421 |
 Vanuatu Vanuatu |
12,600 | 41.379 | 5,000 | 2.52 |
 France France |
8,570 | 0.127 | 9,080 | 0.944 |
 Albania Albania |
6,343.6 | 2.21 | 2,429 | 2.612 |
 Chile Chile |
3,514.04 | 0.2 | 1,470 | 2.391 |
 Bosnia and Herzegovina Bosnia and Herzegovina |
1,816.99 | 0.48 | 1,605 | 1.132 |
 Macedonia Macedonia |
1,466.99 | 0.707 | 938 | 1.564 |
 Peru Peru |
616.78 | 0.02 | 136 | 4.535 |
 Azerbaijan Azerbaijan |
588.1 | 0.059 | 217 | 2.71 |
 Switzerland Switzerland |
265 | 0.031 | 219 | 1.21 |
 Hungary Hungary |
240 | 0.025 | 400 | 0.6 |
 Slovenia Slovenia |
230 | 0.111 | 90 | 2.556 |
 Ukraine Ukraine |
226.53 | 0.005 | 83 | 2.729 |
 Cameroon Cameroon |
146.67 | 0.006 | 146 | 1.005 |
 Zimbabwe Zimbabwe |
90.56 | 0.006 | 78 | 1.161 |
 Romania Romania |
90 | 0.005 | 10 | 9 |
 Croatia Croatia |
30 | 0.007 | 430 | 0.07 |
 Bulgaria Bulgaria |
20 | 0.003 | 20 | 1 |
Top Chestnut Producing Countries by Share
- China dominates the global chestnut market with an impressive 81.3% share of the total production.
- Spain, with its share of 8.3%, is the second-largest producer, far behind China.
- Bolivia contributes almost 4% to the world's chestnut production.
- Turkey holds a share of 3.4% in global chestnut production.
- Combined, these top producers represent a significant portion of the total global production, indicating the concentrated nature of the chestnut industry.