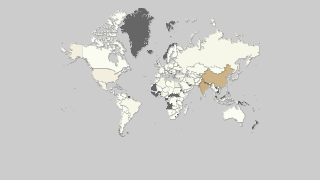
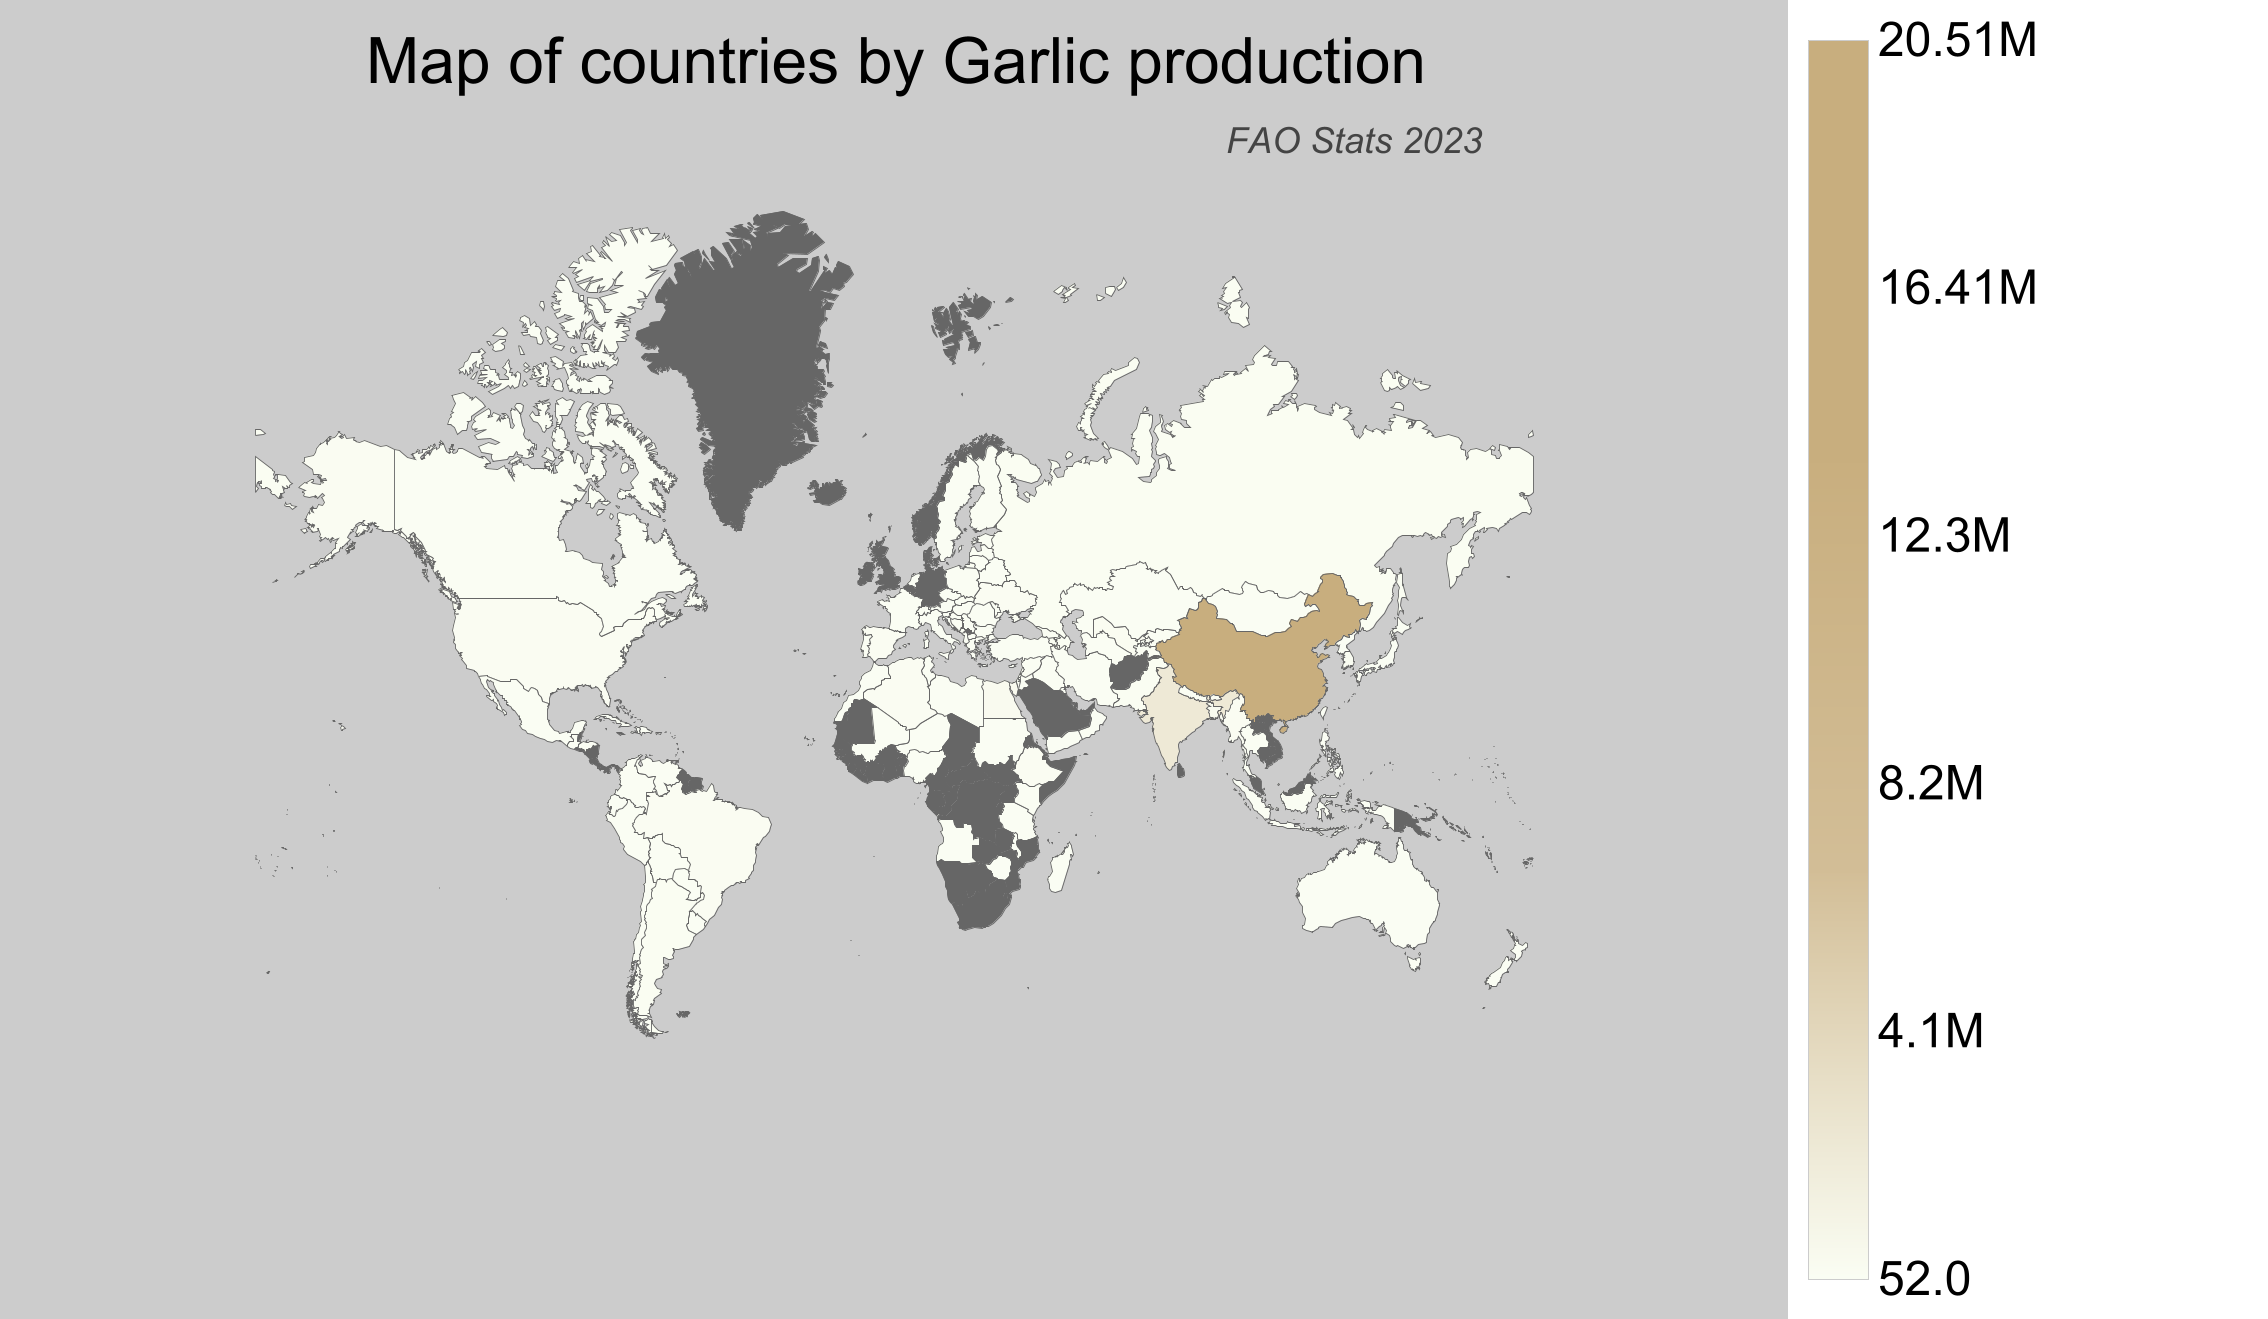
Countries by Garlic production
Garlic, cherished for its culinary and medicinal properties, thrives in moderate temperate climates with well-drained soil. Its versatility makes it a staple across diverse cuisines, enhancing flavors and providing health benefits. As of 2025, the latest data from the Food and Agriculture Organization (FAO) for the year 2023 outlines the current state of global garlic production, highlighting key producers and regional trends.
Global Garlic Production
In 2023, global garlic production reached around 28.67 million tonnes, marking a significant growth from approximately 4.3 million tonnes in 1961. This growth highlights steady expansion over the decades, with notable jumps in production in the early 2000s and mid-2010s. The increase from 1961 to 2023 reflects substantial advancements in agricultural practices and rising demand for garlic worldwide.
Garlic Production by Country
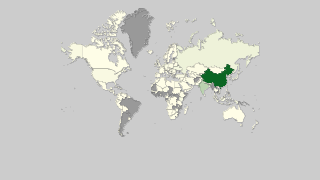
- China dominates garlic production with around 20.51 million tonnes, underscoring its status as the world's largest producer.
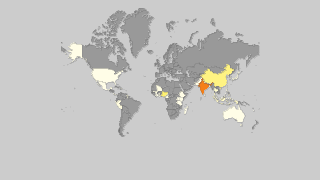
- India, as a significant producer, contributed approximately 3.27 million tonnes to the global garlic supply.
- Bangladesh produced roughly 549 thousand tonnes, maintaining its role as a notable producer.
- Egypt's production stood at about 490 thousand tonnes, contributing to its agricultural exports.
- Canada, although not among the top global producers, produced nearly 1,947 tonnes of garlic, ranking 75th worldwide according to FAO stats.
| Country | Production (tonnes) | Production per Person (kg) | Harvested Area (ha) | Yield (kg/ha) |
|---|---|---|---|---|
 China China |
20,513,385.83 | 14.717 | 831,832 | 24.66 |
 India India |
3,266,022.81 | 2.444 | 408,560 | 7.994 |
 Bangladesh Bangladesh |
548,907 | 3.324 | 71,706 | 7.655 |
 Egypt Egypt |
490,417.53 | 5.03 | 20,437 | 23.997 |
 South Korea South Korea |
318,220 | 6.163 | 24,700 | 12.883 |
 Uzbekistan Uzbekistan |
225,951.8 | 6.92 | 7,320 | 30.868 |
 Algeria Algeria |
212,300.26 | 4.99 | 11,347 | 18.71 |
 Myanmar Myanmar |
207,187.38 | 3.847 | 27,659 | 7.491 |
 Spain Spain |
194,340 | 4.165 | 25,640 | 7.58 |
 Ethiopia Ethiopia |
190,627.96 | 1.773 | 23,708 | 8.041 |
 Ukraine Ukraine |
186,350 | 4.409 | 20,400 | 9.135 |
 Brazil Brazil |
184,844 | 0.882 | 13,544 | 13.648 |
 United States of America United States of America |
182,344 | 0.556 | 10,846 | 16.812 |
 Argentina Argentina |
156,006.63 | 3.506 | 16,069 | 9.709 |
 Russian Federation Russian Federation |
145,746.17 | 0.992 | 15,681 | 9.294 |
 Pakistan Pakistan |
115,390 | 0.572 | 12,993 | 8.881 |
 Mexico Mexico |
110,110.14 | 0.883 | 8,617 | 12.778 |
 Peru Peru |
96,920.36 | 3.103 | 9,069 | 10.687 |
 Kyrgyzstan Kyrgyzstan |
81,606 | 12.934 | 4,840 | 16.861 |
 North Korea North Korea |
77,178.11 | 3.014 | 7,187 | 10.739 |
 Nepal Nepal |
73,567.13 | 2.518 | 9,570 | 7.687 |
 Kazakhstan Kazakhstan |
64,815.49 | 3.547 | 2,688 | 24.113 |
 Iran Iran |
60,405.77 | 0.739 | 4,994 | 12.096 |
 Thailand Thailand |
59,325.84 | 0.858 | 8,725 | 6.8 |
 Taiwan Taiwan |
55,887 | 2.37 | 5,443 | 10.268 |
 Turkey Turkey |
54,127 | 0.634 | 2,417 | 22.394 |
 Syria Syria |
48,349 | 2.644 | 4,419 | 10.941 |
 Indonesia Indonesia |
39,254.43 | 0.148 | 5,341 | 7.35 |
 Guatemala Guatemala |
30,254.28 | 1.749 | 3,422 | 8.841 |
 France France |
29,310 | 0.436 | 4,130 | 7.097 |
 Sudan Sudan |
28,295.48 | 0.694 | 3,197 | 8.851 |
 Italy Italy |
26,730 | 0.442 | 3,380 | 7.908 |
 Chile Chile |
25,739.34 | 1.465 | 2,053 | 12.537 |
 Tunisia Tunisia |
25,432.31 | 2.222 | 2,288 | 11.116 |
 Morocco Morocco |
21,380.5 | 0.615 | 2,736 | 7.815 |
 Azerbaijan Azerbaijan |
20,822.6 | 2.104 | 2,073 | 10.045 |
 Belarus Belarus |
20,760.92 | 2.19 | 1,780 | 11.663 |
 Japan Japan |
20,743.87 | 0.164 | 2,628 | 7.893 |
 Romania Romania |
20,580 | 1.054 | 4,970 | 4.141 |
 Poland Poland |
19,400 | 0.505 | 2,200 | 8.818 |
 Albania Albania |
16,608.58 | 5.786 | 1,062 | 15.639 |
 Mali Mali |
16,404 | 0.859 | 1,134 | 14.466 |
 Venezuela Venezuela |
14,470.14 | 0.455 | 1,634 | 8.856 |
 Angola Angola |
12,484.44 | 0.427 | 917 | 13.614 |
 Tajikistan Tajikistan |
11,704.35 | 1.311 | 785 | 14.91 |
 Colombia Colombia |
10,662.75 | 0.214 | 787 | 13.549 |
 Niger Niger |
10,155.92 | 0.473 | 681 | 14.913 |
 Cuba Cuba |
9,867.85 | 0.879 | 1,679 | 5.877 |
 Moldova Moldova |
9,839 | 2.771 | 4,153 | 2.369 |
 Portugal Portugal |
9,100 | 0.884 | 630 | 14.444 |
 Dominican Republic Dominican Republic |
8,595.46 | 0.837 | 1,206 | 7.127 |
 Armenia Armenia |
8,319.4 | 2.801 | 737 | 11.288 |
 Tanzania Tanzania |
6,208.31 | 0.115 | 1,755 | 3.537 |
 Jordan Jordan |
6,183 | 0.604 | 260 | 23.781 |
 Bosnia and Herzegovina Bosnia and Herzegovina |
6,064 | 1.602 | 604 | 10.04 |
 Philippines Philippines |
5,765.06 | 0.054 | 2,383 | 2.419 |
 Macedonia Macedonia |
5,509 | 2.655 | 901 | 6.114 |
 Hungary Hungary |
5,260 | 0.538 | 710 | 7.408 |
 Libya Libya |
4,879.62 | 0.754 | 858 | 5.687 |
 Oman Oman |
4,433 | 0.885 | 214 | 20.715 |
 Greece Greece |
4,080 | 0.379 | 590 | 6.915 |
 Iraq Iraq |
3,505 | 0.089 | 544 | 6.443 |
 Kenya Kenya |
3,365.84 | 0.066 | 269 | 12.512 |
 Turkmenistan Turkmenistan |
3,215.32 | 0.549 | 316 | 10.175 |
 Yemen Yemen |
3,191.26 | 0.11 | 418 | 7.635 |
 Serbia Serbia |
3,137.93 | 0.448 | 1,359 | 2.309 |
 Lebanon Lebanon |
2,999.12 | 0.492 | 307 | 9.769 |
 Zimbabwe Zimbabwe |
2,801.01 | 0.189 | 462 | 6.063 |
 Australia Australia |
2,730 | 0.109 | 400 | 6.825 |
 Madagascar Madagascar |
2,538.62 | 0.097 | 388 | 6.543 |
 The Netherlands The Netherlands |
2,360 | 0.137 | 170 | 13.882 |
 Bolivia Bolivia |
2,355.39 | 0.208 | 533 | 4.419 |
 Nigeria Nigeria |
2,201.72 | 0.011 | 169 | 13.028 |
 Mongolia Mongolia |
2,057.51 | 0.638 | 351 | 5.862 |
 Canada Canada |
1,947 | 0.052 | 910 | 2.14 |
 New Zealand New Zealand |
1,933.37 | 0.394 | 321 | 6.023 |
 Georgia Georgia |
1,900 | 0.509 | 600 | 3.167 |
 Austria Austria |
1,570 | 0.178 | 280 | 5.607 |
 Czech Republic Czech Republic |
1,550 | 0.146 | 380 | 4.079 |
 Croatia Croatia |
1,430 | 0.341 | 240 | 5.958 |
 Ecuador Ecuador |
1,298.29 | 0.076 | 841 | 1.544 |
 Bulgaria Bulgaria |
1,070 | 0.152 | 270 | 3.963 |
 Palestinian Territories Palestinian Territories |
1,045.25 | 0.23 | 64 | 16.332 |
 Haiti Haiti |
1,030.35 | 0.093 | 39 | 26.419 |
 Montenegro Montenegro |
947.31 | 1.522 | 252 | 3.759 |
 Uruguay Uruguay |
887.22 | 0.253 | 170 | 5.219 |
 Slovakia Slovakia |
860 | 0.158 | 130 | 6.615 |
 Slovenia Slovenia |
800 | 0.387 | 150 | 5.333 |
 Lithuania Lithuania |
750 | 0.268 | 430 | 1.744 |
 Latvia Latvia |
710 | 0.369 | 410 | 1.732 |
 Israel Israel |
424 | 0.048 | 469 | 0.904 |
 East Timor East Timor |
393.61 | 0.312 | 196 | 2.008 |
 Bhutan Bhutan |
366.16 | 0.504 | 147 | 2.491 |
 Cyprus Cyprus |
359.27 | 0.42 | 21 | 17.108 |
 Malta Malta |
358 | 0.753 | 43 | 8.326 |
 Malawi Malawi |
339.88 | 0.019 | 47 | 7.231 |
 Switzerland Switzerland |
288 | 0.034 | 67 | 4.299 |
 Paraguay Paraguay |
286.84 | 0.041 | 91 | 3.152 |
 Kuwait Kuwait |
230 | 0.054 | 4 | 57.5 |
 Honduras Honduras |
197.37 | 0.022 | 53 | 3.724 |
 Cape Verde Cape Verde |
86.26 | 0.159 | 17 | 5.074 |
 Finland Finland |
80 | 0.014 | 70 | 1.143 |
 Sweden Sweden |
70 | 0.007 | 20 | 3.5 |
 Estonia Estonia |
60 | 0.045 | 60 | 1 |
 Mauritius Mauritius |
52 | 0.041 | 12 | 4.333 |
Top Garlic Producing Countries by Share
- China alone accounts for about 71.5% of the world's garlic production, emphasizing its overwhelming influence in the market.
- India contributes approximately 11.4% to the global garlic production, highlighting its importance as a key player in the sector.
- The collective production share of Bangladesh and Egypt is around 3.6%, showcasing their roles in regional production.
- Canada holds a mere 0.0068% of the global production, illustrating its smaller scale but growing diversity in agricultural outputs.