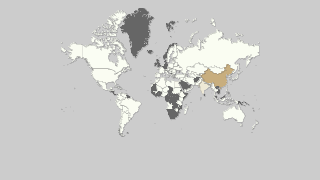
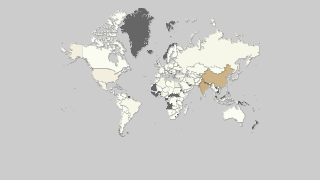
Countries by Ginger production
Ginger is a vital spice used globally for its aromatic and medicinal properties. It thrives in warm, humid climates, making it a staple in regions with such environmental conditions. The latest data for ginger production, as of 2023, is derived from the Food and Agriculture Organization (FAO) stats database. This data reflects global trends and changes in ginger production over the years.
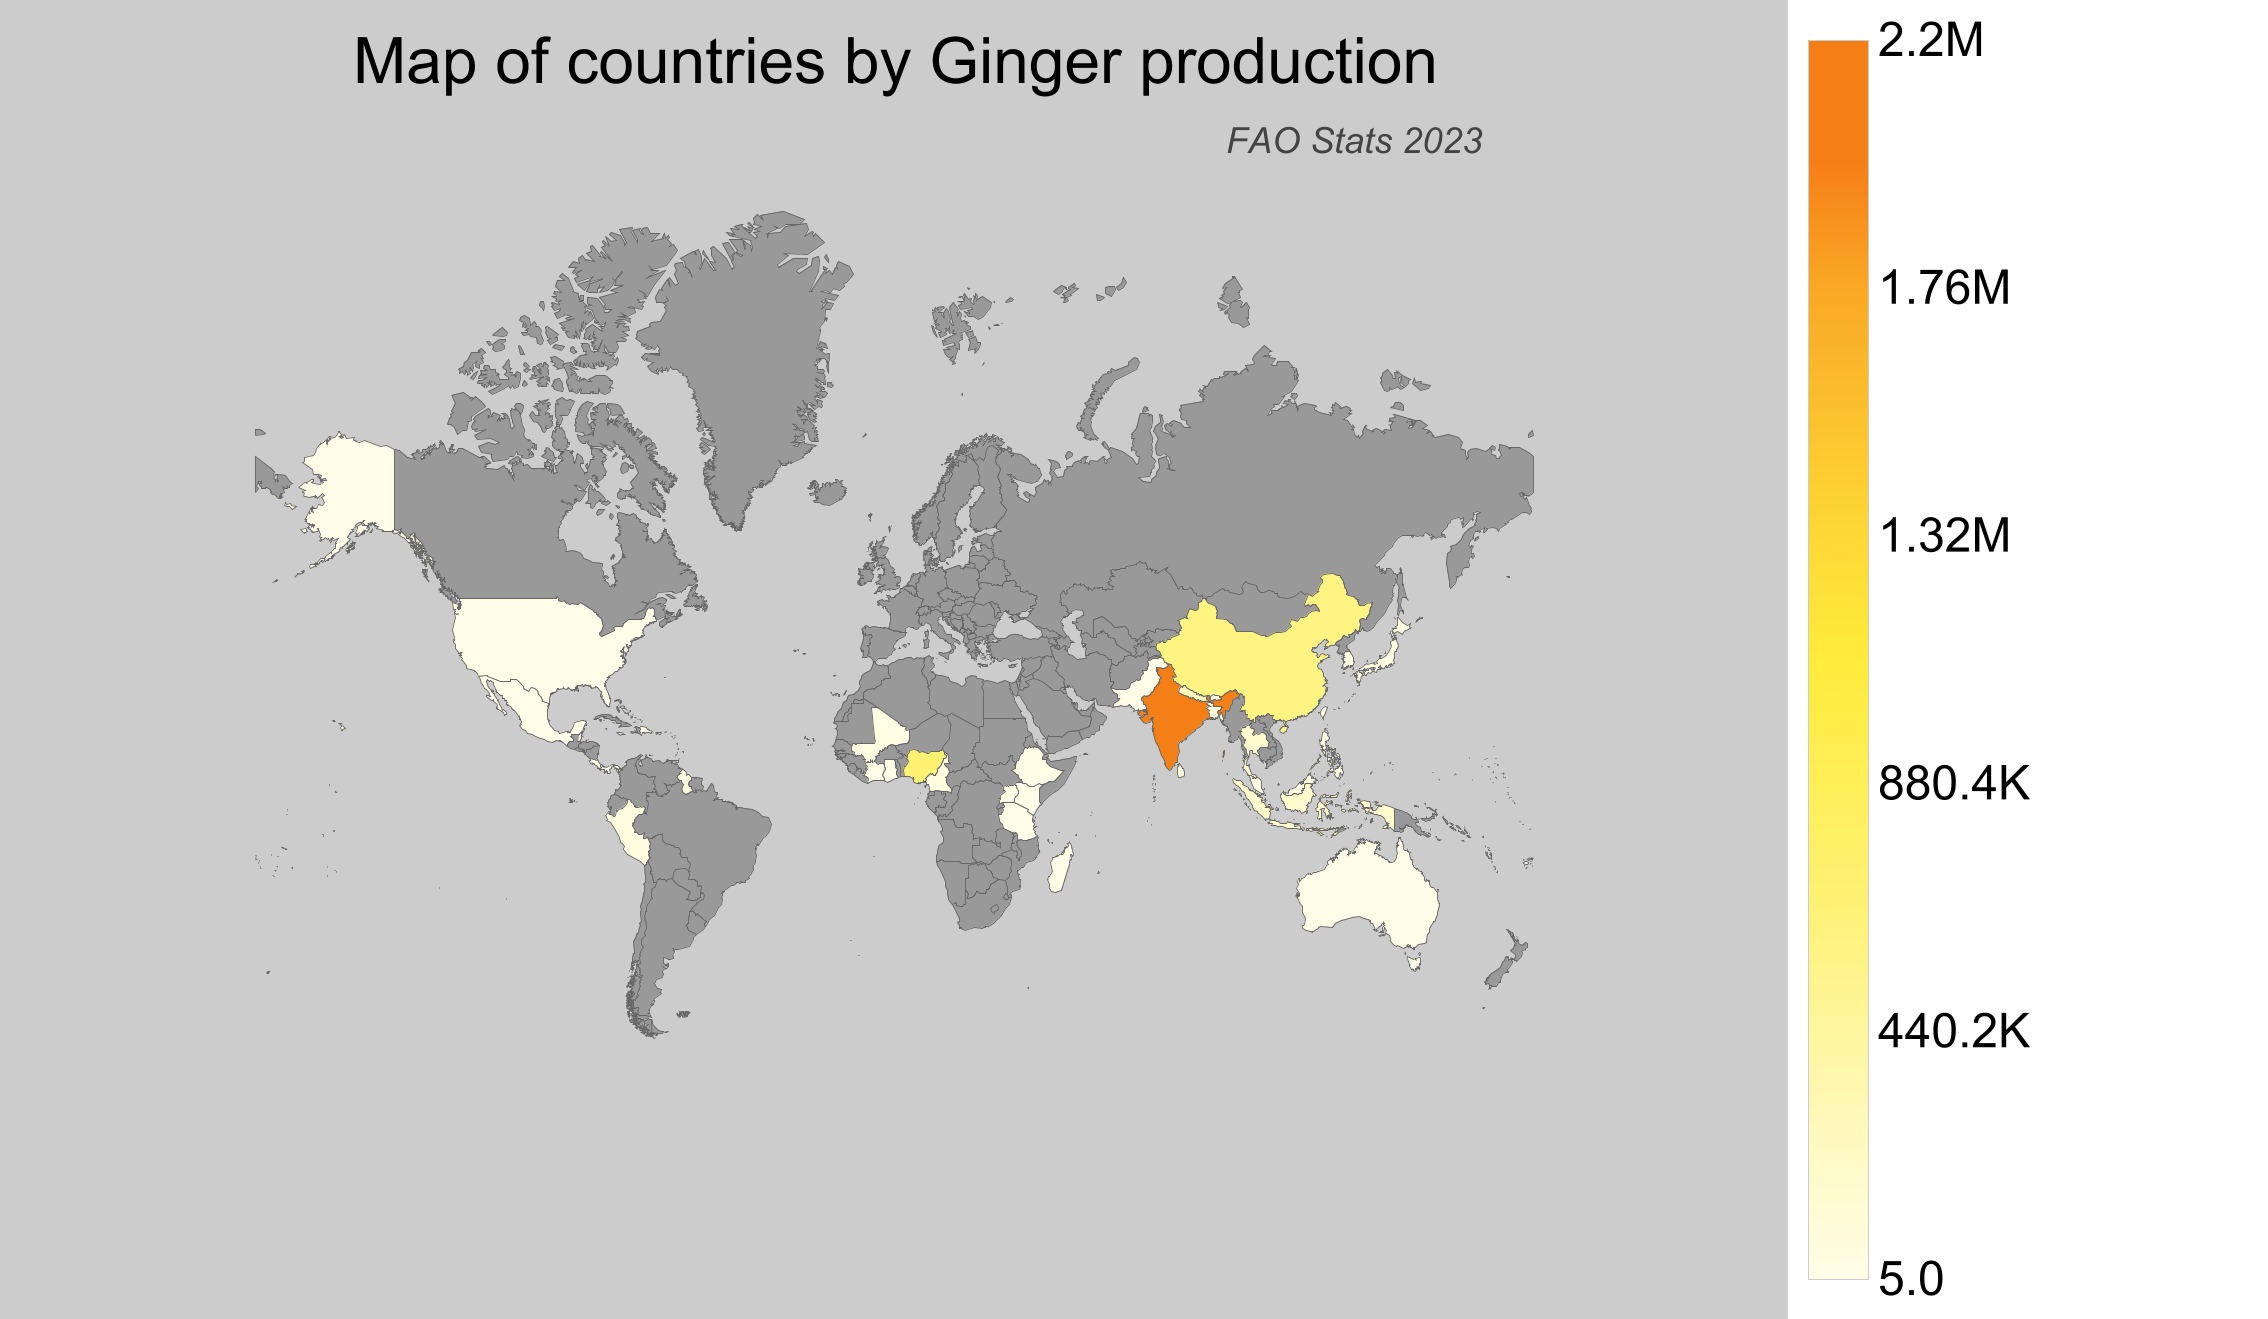
Global Ginger Production
In 2023, the global ginger production reached approximately 4.88 million tonnes. Over the years, there has been a remarkable increase from around 60 thousand tonnes in 1961 to the current production figures. This growth reflects the rising global demand and the expansion of cultivation areas in top-producing countries. From 1961 to 2023, production has increased significantly, evidencing a strong upward trend.
Ginger Production by Country
- India is the leading producer of ginger, with an impressive output of about 2.20 million tonnes.
- Nigeria follows as a significant producer, yielding approximately 782 thousand tonnes.
- China contributes a substantial 661 thousand tonnes to the global ginger market.
- Nepal produces around 310 thousand tonnes, making it an important player in the ginger industry.
- According to FAO stats, Canada does not produce any ginger.
| Country | Production (tonnes) | Production per Person (kg) | Harvested Area (ha) | Yield (kg/ha) |
|---|---|---|---|---|
 India India |
2,201,000 | 1.647 | 191,000 | 11.524 |
 Nigeria Nigeria |
781,640.72 | 3.96 | 89,827 | 8.702 |
 China China |
660,834.16 | 0.474 | 61,722 | 10.707 |
 Nepal Nepal |
309,533.18 | 10.594 | 23,829 | 12.99 |
 Indonesia Indonesia |
198,873.34 | 0.75 | 8,343 | 23.837 |
 Thailand Thailand |
174,103.24 | 2.517 | 10,449 | 16.662 |
 Bangladesh Bangladesh |
83,726 | 0.507 | 10,399 | 8.051 |
 Peru Peru |
62,228.68 | 1.992 | 8,364 | 7.44 |
 Sri Lanka Sri Lanka |
59,514 | 2.775 | 5,561 | 10.702 |
 Cameroon Cameroon |
51,763.48 | 2.175 | 4,970 | 10.415 |
 Guyana Guyana |
51,168.61 | 65.414 | 4,289 | 11.93 |
 Japan Japan |
45,032.77 | 0.356 | 1,649 | 27.309 |
 Mali Mali |
36,783.4 | 1.925 | 2,876 | 12.79 |
 Philippines Philippines |
29,153.73 | 0.274 | 4,816 | 6.054 |
 South Korea South Korea |
26,012.02 | 0.504 | 2,303 | 11.295 |
 Taiwan Taiwan |
22,237 | 0.943 | 851 | 26.13 |
 Fiji Fiji |
15,780.8 | 17.834 | 631 | 25.009 |
 Ethiopia Ethiopia |
9,734.39 | 0.091 | 3,602 | 2.702 |
 Malaysia Malaysia |
9,089.85 | 0.278 | 721 | 12.607 |
 Côte d'Ivoire Côte d'Ivoire |
6,908.23 | 0.277 | 537 | 12.864 |
 Panama Panama |
5,017.99 | 1.207 | 468 | 10.722 |
 Australia Australia |
4,922 | 0.196 | 450 | 10.938 |
 Costa Rica Costa Rica |
3,893.36 | 0.778 | 332 | 11.727 |
 Bhutan Bhutan |
3,076.03 | 4.23 | 653 | 4.711 |
 Mexico Mexico |
2,705.15 | 0.022 | 238 | 11.366 |
 Mauritius Mauritius |
1,758 | 1.39 | 77 | 22.831 |
 Uganda Uganda |
1,589.85 | 0.041 | 465 | 3.419 |
 Tanzania Tanzania |
987.67 | 0.018 | 208 | 4.748 |
 Jamaica Jamaica |
941 | 0.345 | 280 | 3.361 |
 Kenya Kenya |
740.36 | 0.015 | 60 | 12.339 |
 United States of America United States of America |
661.79 | 0.002 | 19 | 34.831 |
 Madagascar Madagascar |
392.91 | 0.015 | 119 | 3.302 |
 Dominican Republic Dominican Republic |
199.69 | 0.019 | 49 | 4.075 |
 Vanuatu Vanuatu |
180 | 0.591 | 7 | 25.714 |
 Dominica Dominica |
167.86 | 2.355 | 64 | 2.623 |
 Grenada Grenada |
130 | 1.258 | 41 | 3.171 |
 Ghana Ghana |
95.87 | 0.003 | 85 | 1.128 |
 Belize Belize |
81 | 0.205 | 11 | 7.364 |
 Saint Lucia Saint Lucia |
23 | 0.129 | 4 | 5.75 |
 Trinidad and Tobago Trinidad and Tobago |
11 | 0.008 | 3 | 3.667 |
 Pakistan Pakistan |
5 | 0 | 6 | 0.833 |
Top Ginger Producing Countries by Share
- India dominates the global ginger production with a significant share of approximately 45.13%.
- Nigeria accounts for about 16.03% of the world's ginger production.
- China contributes 13.55% to the global ginger supply.
- Nepal holds a 6.35% share in the world's ginger production.
- Together, these countries account for a majority of the global ginger supply, showcasing the concentration of production in a few key regions.