Countries by Onion production
Onions are a quintessential vegetable in cuisines worldwide, known for their versatility and health benefits. Thriving in temperate climates, onions are cultivated in a variety of regions across the globe. Our latest data from the Food and Agriculture Organization (FAO), as of 2023, reveals the current state of global onion production, highlighting the significant players in this crucial agricultural sector.
Global Onion Production
In 2023, global onion production reached approximately 111 million tonnes, showing a significant upward trend from around 13.9 million tonnes in 1961. Over the decades, onion production has steadily increased, with major leaps around the late 20th and early 21st centuries. This growth highlights the increasing demand and improved agricultural practices. From 1961 to 2023, production grew more than sevenfold, emphasizing onions' importance in global agriculture.
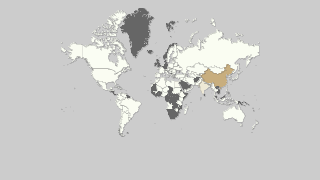
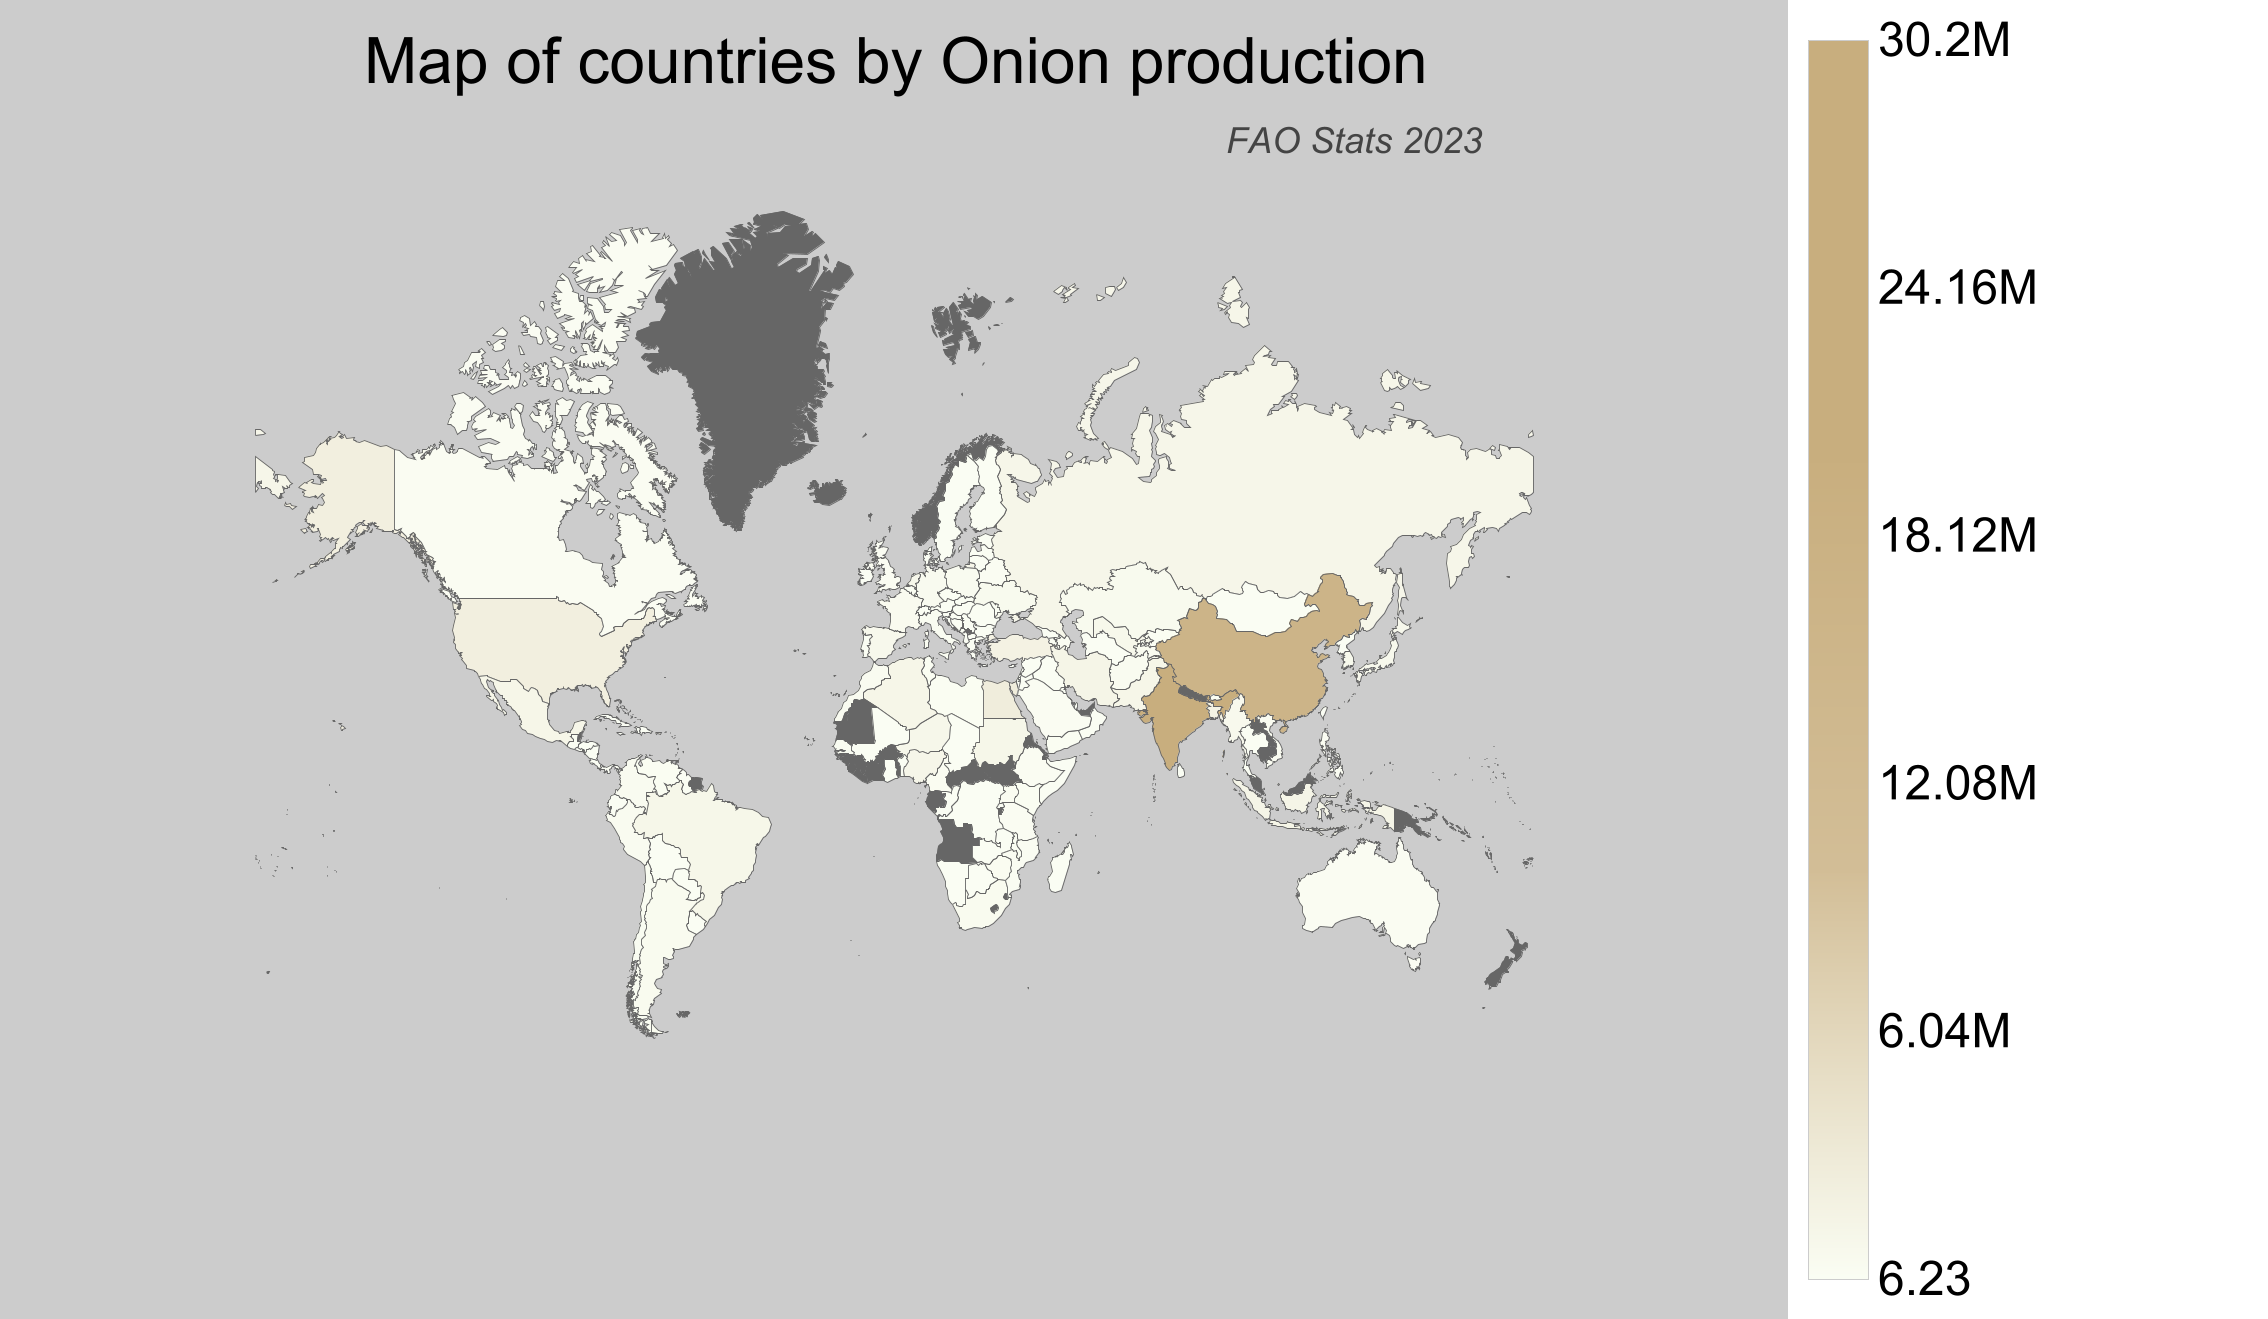
Onion Production by Country
- India led the global onion production with approximately 30.2 million tonnes in 2023, accounting for a significant portion of the world's output.
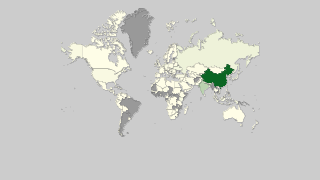
- China followed closely, producing about 24.2 million tonnes, showcasing its vital role in the culinary world and agriculture.
- Egypt, with a production volume of around 3.8 million tonnes, is a noteworthy contributor, particularly renowned for its high-quality onions.
- The United States of America also made a mark, producing approximately 3.3 million tonnes of onions in 2023.
- Canada produced about 276,565 tonnes in 2023, highlighting its participation in the global market, ranked 47th in production. Despite not being among the top producers, Canada plays an essential role in the regional supply.
| Country | Production (tonnes) | Production per Person (kg) | Harvested Area (ha) | Yield (kg/ha) |
|---|---|---|---|---|
 India India |
30,208,000 | 22.603 | 1,740,000 | 17.361 |
 China China |
24,222,542.46 | 17.378 | 1,100,796 | 22.005 |
 Egypt Egypt |
3,804,076.72 | 39.018 | 104,569 | 36.379 |
 United States of America United States of America |
3,315,421 | 10.115 | 54,107 | 61.275 |
 Turkey Turkey |
2,600,000 | 30.455 | 60,487 | 42.984 |
 Bangladesh Bangladesh |
2,546,994 | 15.425 | 203,606 | 12.509 |
 Iran Iran |
2,099,865.85 | 25.684 | 54,452 | 38.564 |
 Indonesia Indonesia |
1,985,233.34 | 7.491 | 181,683 | 10.927 |
 Pakistan Pakistan |
1,843,494 | 9.132 | 135,499 | 13.605 |
 Algeria Algeria |
1,813,467.25 | 42.624 | 49,177 | 36.876 |
 Mexico Mexico |
1,801,137.36 | 14.439 | 55,727 | 32.321 |
 Russian Federation Russian Federation |
1,714,071.7 | 11.67 | 53,435 | 32.078 |
 Nigeria Nigeria |
1,692,279.67 | 8.573 | 622,674 | 2.718 |
 Brazil Brazil |
1,639,970 | 7.827 | 49,358 | 33.226 |
 Sudan Sudan |
1,627,394.95 | 39.89 | 89,751 | 18.132 |
 Niger Niger |
1,621,936.43 | 75.555 | 50,116 | 32.364 |
 The Netherlands The Netherlands |
1,605,300 | 93.054 | 34,960 | 45.918 |
 Uzbekistan Uzbekistan |
1,318,528.13 | 40.379 | 36,805 | 35.825 |
 Spain Spain |
1,205,350 | 25.833 | 23,260 | 51.821 |
 Japan Japan |
1,204,087.39 | 9.519 | 25,175 | 47.829 |
 South Korea South Korea |
1,172,848 | 22.714 | 17,282 | 67.865 |
 Myanmar Myanmar |
1,050,093.97 | 19.496 | 70,776 | 14.837 |
 Ukraine Ukraine |
889,010 | 21.035 | 46,700 | 19.037 |
 Kazakhstan Kazakhstan |
812,780.22 | 44.481 | 26,620 | 30.533 |
 Germany Germany |
759,560 | 9.18 | 17,430 | 43.578 |
 France France |
742,150 | 11.028 | 21,780 | 34.075 |
 Argentina Argentina |
687,701.77 | 15.456 | 20,677 | 33.259 |
 South Africa South Africa |
661,827 | 11.465 | 26,550 | 24.928 |
 Tajikistan Tajikistan |
648,668.08 | 72.631 | 18,450 | 35.158 |
 Colombia Colombia |
647,179.9 | 12.962 | 26,206 | 24.696 |
 Poland Poland |
635,300 | 16.53 | 22,200 | 28.617 |
 Morocco Morocco |
621,309.9 | 17.867 | 19,687 | 31.559 |
 Afghanistan Afghanistan |
586,000 | 18.559 | 34,000 | 17.235 |
 Peru Peru |
537,260.82 | 17.199 | 14,375 | 37.375 |
 Senegal Senegal |
421,464.45 | 26.8 | 13,376 | 31.509 |
 Chile Chile |
409,514.32 | 23.302 | 8,494 | 48.212 |
 Italy Italy |
380,470 | 6.295 | 12,700 | 29.958 |
 Cameroon Cameroon |
361,744.81 | 15.203 | 37,417 | 9.668 |
 Vietnam Vietnam |
360,236.55 | 3.806 | 102,169 | 3.526 |
 Zimbabwe Zimbabwe |
357,042.76 | 24.045 | 13,281 | 26.884 |
 Uganda Uganda |
329,933.03 | 8.498 | 81,782 | 4.034 |
 Azerbaijan Azerbaijan |
310,259.4 | 31.345 | 11,027 | 28.136 |
 Tanzania Tanzania |
303,834.41 | 5.606 | 28,673 | 10.597 |
 Ethiopia Ethiopia |
302,563.65 | 2.814 | 34,505 | 8.769 |
 Saudi Arabia Saudi Arabia |
298,580.67 | 8.936 | 7,832 | 38.123 |
 United Kingdom United Kingdom |
293,154.9 | 4.439 | 7,349 | 39.89 |
 Canada Canada |
276,565 | 7.432 | 5,841 | 47.349 |
 Australia Australia |
255,159 | 10.186 | 4,539 | 56.215 |
 Mozambique Mozambique |
254,292 | 8.811 | 28,172 | 9.026 |
 Philippines Philippines |
252,487.47 | 2.373 | 21,325 | 11.84 |
 Belarus Belarus |
238,738.74 | 25.188 | 11,615 | 20.554 |
 Yemen Yemen |
231,908.72 | 8.02 | 15,995 | 14.499 |
 Kyrgyzstan Kyrgyzstan |
215,745 | 34.195 | 8,961 | 24.076 |
 Guatemala Guatemala |
189,761.63 | 10.968 | 6,272 | 30.255 |
 Libya Libya |
188,838.92 | 29.183 | 9,071 | 20.818 |
 Tunisia Tunisia |
188,769.44 | 16.492 | 6,027 | 31.321 |
 Venezuela Venezuela |
186,730.12 | 5.867 | 8,739 | 21.367 |
 Belgium Belgium |
172,060 | 15.071 | 5,120 | 33.605 |
 Malawi Malawi |
171,375.23 | 9.557 | 8,738 | 19.613 |
 Kenya Kenya |
163,100 | 3.201 | 11,056 | 14.752 |
 Austria Austria |
159,530 | 18.05 | 3,570 | 44.686 |
 Ghana Ghana |
146,436.53 | 4.945 | 8,088 | 18.105 |
 Bolivia Bolivia |
144,904.31 | 12.815 | 9,648 | 15.019 |
 Romania Romania |
142,760 | 7.312 | 15,460 | 9.234 |
 Jordan Jordan |
138,992 | 13.585 | 3,527 | 39.408 |
 Albania Albania |
117,109.9 | 40.8 | 5,357 | 21.861 |
 Greece Greece |
109,050 | 10.127 | 3,130 | 34.84 |
 Dominican Republic Dominican Republic |
105,375.56 | 10.264 | 5,291 | 19.916 |
 Syria Syria |
99,167 | 5.424 | 5,610 | 17.677 |
 Benin Benin |
94,906.43 | 8.353 | 8,387 | 11.316 |
 Turkmenistan Turkmenistan |
89,488.56 | 15.293 | 3,286 | 27.233 |
 North Korea North Korea |
86,364.22 | 3.372 | 9,191 | 9.397 |
 Israel Israel |
84,096 | 9.441 | 4,051 | 20.759 |
 Mali Mali |
80,980.41 | 4.238 | 4,196 | 19.299 |
 Lebanon Lebanon |
72,474.44 | 11.894 | 1,786 | 40.579 |
 Sweden Sweden |
71,510 | 7.03 | 1,490 | 47.993 |
 Moldova Moldova |
66,620 | 18.761 | 7,702 | 8.65 |
 Cuba Cuba |
63,063.35 | 5.62 | 11,186 | 5.638 |
 Macedonia Macedonia |
61,030 | 29.408 | 3,385 | 18.03 |
 Taiwan Taiwan |
58,642 | 2.487 | 1,205 | 48.666 |
 Czech Republic Czech Republic |
58,520 | 5.514 | 1,920 | 30.479 |
 Hungary Hungary |
58,220 | 5.958 | 1,670 | 34.862 |
 Denmark Denmark |
57,170 | 9.874 | 1,440 | 39.701 |
 Portugal Portugal |
56,920 | 5.531 | 1,380 | 41.246 |
 Congo-Kinshasa Congo-Kinshasa |
56,194.59 | 0.691 | 10,707 | 5.248 |
 Sri Lanka Sri Lanka |
54,435 | 2.538 | 4,206 | 12.942 |
 Costa Rica Costa Rica |
46,789 | 9.351 | 1,447 | 32.335 |
 Zambia Zambia |
40,983.32 | 2.427 | 2,565 | 15.978 |
 Bulgaria Bulgaria |
38,960 | 5.526 | 3,020 | 12.901 |
 Switzerland Switzerland |
38,720 | 4.559 | 1,338 | 28.939 |
 Armenia Armenia |
38,101.7 | 12.83 | 1,119 | 34.05 |
 Thailand Thailand |
36,266.8 | 0.524 | 1,448 | 25.046 |
 Bosnia and Herzegovina Bosnia and Herzegovina |
35,312 | 9.331 | 2,053 | 17.2 |
 Rwanda Rwanda |
35,307.58 | 2.942 | 3,495 | 10.102 |
 Slovakia Slovakia |
33,940 | 6.235 | 1,030 | 32.951 |
 Finland Finland |
31,700 | 5.745 | 1,210 | 26.198 |
 Uruguay Uruguay |
31,586.97 | 9.009 | 1,337 | 23.625 |
 Paraguay Paraguay |
31,334.29 | 4.443 | 5,411 | 5.791 |
 Palestinian Territories Palestinian Territories |
28,986.61 | 6.371 | 1,067 | 27.166 |
 Serbia Serbia |
27,892.57 | 3.984 | 4,022 | 6.935 |
 Iraq Iraq |
27,360 | 0.695 | 2,810 | 9.737 |
 Nicaragua Nicaragua |
26,360.34 | 4.194 | 941 | 28.013 |
 Namibia Namibia |
26,278.15 | 10.887 | 1,481 | 17.744 |
 Lithuania Lithuania |
25,370 | 9.058 | 1,450 | 17.497 |
 Mongolia Mongolia |
25,028.87 | 7.763 | 1,926 | 12.995 |
 Panama Panama |
24,228.96 | 5.826 | 965 | 25.108 |
 Chad Chad |
22,126.12 | 1.441 | 1,701 | 13.008 |
 Croatia Croatia |
16,090 | 3.838 | 660 | 24.379 |
 Kuwait Kuwait |
15,660 | 3.705 | 388 | 40.361 |
 Honduras Honduras |
15,617.49 | 1.733 | 661 | 23.627 |
 Guyana Guyana |
15,383 | 19.666 | 239 | 64.364 |
 Oman Oman |
14,744 | 2.942 | 474 | 31.105 |
 Madagascar Madagascar |
10,823.76 | 0.412 | 2,001 | 5.409 |
 Ecuador Ecuador |
10,209.58 | 0.598 | 4,139 | 2.467 |
 Slovenia Slovenia |
9,490 | 4.591 | 490 | 19.367 |
 Haiti Haiti |
8,761.59 | 0.788 | 1,755 | 4.992 |
 Mauritius Mauritius |
8,443 | 6.675 | 596 | 14.166 |
 Ireland Ireland |
8,200 | 1.688 | 260 | 31.538 |
 Latvia Latvia |
7,910 | 4.108 | 460 | 17.196 |
 Malta Malta |
7,460 | 15.682 | 0 | ∞ |
 Georgia Georgia |
7,000 | 1.877 | 900 | 7.778 |
 Botswana Botswana |
6,703.8 | 2.911 | 184 | 36.434 |
 Jamaica Jamaica |
6,086 | 2.23 | 290 | 20.986 |
 Somalia Somalia |
5,685.09 | 0.374 | 3,758 | 1.513 |
 Cyprus Cyprus |
4,380 | 5.124 | 140 | 31.286 |
 Cape Verde Cape Verde |
2,714.79 | 4.99 | 103 | 26.357 |
 Qatar Qatar |
2,560 | 1.045 | 110 | 23.273 |
 El Salvador El Salvador |
1,687.36 | 0.254 | 83 | 20.33 |
 Luxembourg Luxembourg |
1,400 | 2.326 | 60 | 23.333 |
 Bahrain Bahrain |
1,120 | 0.749 | 36 | 31.111 |
 Barbados Barbados |
1,037.68 | 3.623 | 43 | 24.132 |
 Montenegro Montenegro |
1,007.28 | 1.618 | 51 | 19.751 |
 The Bahamas The Bahamas |
832.06 | 2.182 | 116 | 7.173 |
 Congo-Brazzaville Congo-Brazzaville |
627.06 | 0.116 | 59 | 10.628 |
 São Tomé and Príncipe São Tomé and Príncipe |
362.58 | 1.834 | 35 | 10.359 |
 Estonia Estonia |
230 | 0.174 | 40 | 5.75 |
 Bhutan Bhutan |
184.38 | 0.254 | 77 | 2.395 |
 Saint Kitts and Nevis Saint Kitts and Nevis |
42 | 0.909 | 4 | 10.5 |
 Maldives Maldives |
39.54 | 0.105 | 10 | 3.954 |
 Antigua and Barbuda Antigua and Barbuda |
6.23 | 0.072 | 6 | 1.038 |
Top Onion Producing Countries by Share
- India holds the largest share of global onion production, with 27.1%, underscoring its dominance in this agricultural sector.
- China's production accounted for 21.8% of the global total, making it a major player in the onion market.
- Egypt contributed 3.4% to the world production, reflecting its importance in regional agriculture.
- The United States accounts for nearly 3% of global production, stressing its significance in not just cultivation but also technological advancements in agriculture.
- Combined, India and China produced nearly half of the world's onions in 2023, emphasizing their substantial influence on the global market. Canada, despite its smaller scale of production, significantly contributes to the Western markets.