Countries by Cabbage production
Cabbage, a nutritious leafy green vegetable, plays a significant role in diets around the world due to its high content of vitamins and minerals. It thrives in cool climates, making regions with temperate weather ideal for its cultivation. According to the latest available data in 2025, from the Food and Agriculture Organization (FAO) stats database, global cabbage production in 2023 was approximately 73.8 million tonnes.
Global Cabbage Production
In 2023, the global cabbage production reached around 73.8 million tonnes, continuing a trend of fluctuating growth observed since 1961, when the production was approximately 23.4 million tonnes. This represents a significant increase of over 50 million tonnes in the span of six decades, illustrating cabbage's growing importance as a staple crop worldwide.
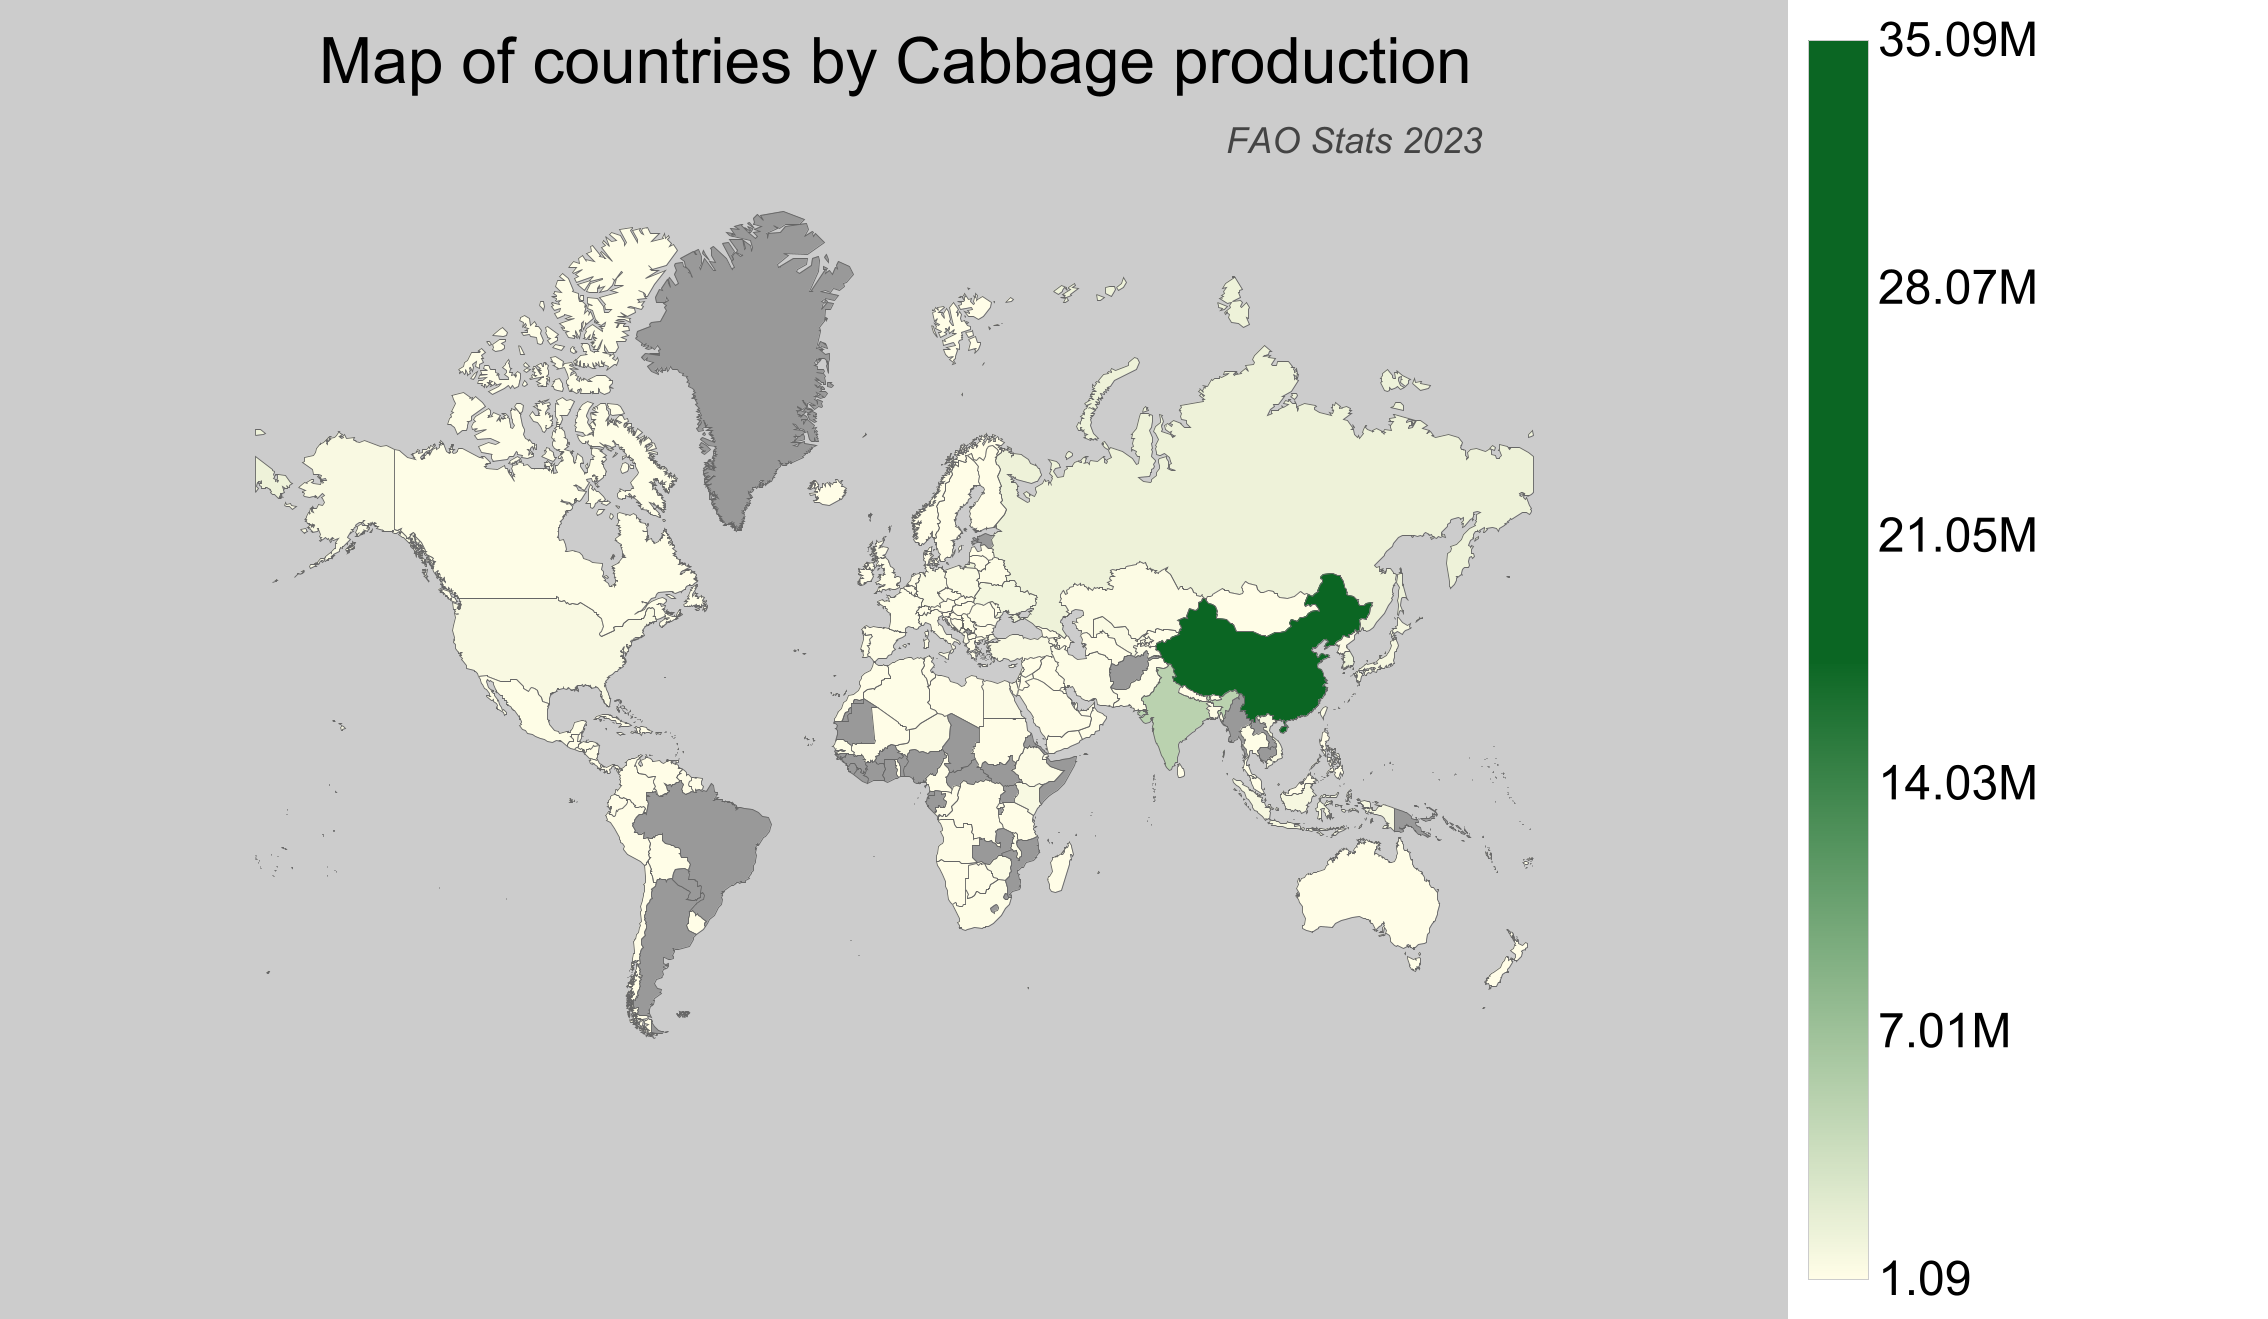
Cabbage Production by Country
- China is the leading cabbage producer with around 35.1 million tonnes produced, accounting for nearly half of the global production.
- India follows as the second-largest producer with approximately 10.1 million tonnes.
- The Russian Federation ranks third with a production volume of about 2.57 million tonnes.
- South Korea is close behind with a production volume of 2.45 million tonnes.
- Canada, though not among the top producers, contributes around 160,000 tonnes to global production, ranking 37th.
| Country | Production (tonnes) | Production per Person (kg) | Harvested Area (ha) | Yield (kg/ha) |
|---|---|---|---|---|
 China China |
35,092,621.83 | 25.177 | 1,002,516 | 35.005 |
 India India |
10,049,000 | 7.519 | 433,000 | 23.208 |
 Russian Federation Russian Federation |
2,569,253.64 | 17.493 | 70,278 | 36.558 |
 South Korea South Korea |
2,453,436.33 | 47.515 | 36,507 | 67.205 |
 Ukraine Ukraine |
1,587,370 | 37.559 | 61,300 | 25.895 |
 Japan Japan |
1,420,448.22 | 11.23 | 33,800 | 42.025 |
 Indonesia Indonesia |
1,399,005.25 | 5.279 | 61,932 | 22.589 |
 Vietnam Vietnam |
1,165,262.72 | 12.31 | 38,516 | 30.254 |
 Kenya Kenya |
1,042,800 | 20.467 | 31,771 | 32.822 |
 Turkey Turkey |
988,111 | 11.574 | 22,386 | 44.14 |
 United States of America United States of America |
963,068 | 2.938 | 20,922 | 46.031 |
 Uzbekistan Uzbekistan |
848,860.64 | 25.996 | 14,479 | 58.627 |
 North Korea North Korea |
704,098.81 | 27.492 | 28,629 | 24.594 |
 Poland Poland |
666,200 | 17.334 | 15,800 | 42.165 |
 Germany Germany |
660,620 | 7.984 | 11,960 | 55.236 |
 Zimbabwe Zimbabwe |
626,540.96 | 42.194 | 18,348 | 34.148 |
 Taiwan Taiwan |
611,713 | 25.946 | 16,391 | 37.32 |
 Niger Niger |
574,539.41 | 26.764 | 20,761 | 27.674 |
 Kazakhstan Kazakhstan |
547,626.09 | 29.97 | 19,960 | 27.436 |
 Egypt Egypt |
508,572.1 | 5.216 | 17,406 | 29.218 |
 Ethiopia Ethiopia |
487,704.29 | 4.535 | 49,846 | 9.784 |
 Bangladesh Bangladesh |
422,322 | 2.558 | 21,645 | 19.511 |
 Italy Italy |
396,700 | 6.564 | 21,400 | 18.537 |
 Belarus Belarus |
364,723 | 38.48 | 8,995 | 40.547 |
 Romania Romania |
357,610 | 18.316 | 19,140 | 18.684 |
 Iran Iran |
300,003.01 | 3.669 | 7,156 | 41.923 |
 Angola Angola |
284,733 | 9.734 | 9,670 | 29.445 |
 Spain Spain |
264,750 | 5.674 | 11,910 | 22.229 |
 The Netherlands The Netherlands |
259,760 | 15.057 | 5,740 | 45.254 |
 Mexico Mexico |
227,321.92 | 1.822 | 6,654 | 34.163 |
 Thailand Thailand |
211,893.13 | 3.063 | 8,006 | 26.467 |
 South Africa South Africa |
207,064 | 3.587 | 3,561 | 58.148 |
 Malawi Malawi |
200,221.12 | 11.166 | 9,520 | 21.032 |
 Portugal Portugal |
182,460 | 17.73 | 6,720 | 27.152 |
 France France |
175,670 | 2.61 | 7,910 | 22.209 |
 United Kingdom United Kingdom |
166,339.48 | 2.519 | 6,682 | 24.894 |
 Canada Canada |
159,995 | 4.299 | 5,778 | 27.69 |
 Serbia Serbia |
158,660.63 | 22.661 | 7,111 | 22.312 |
 Senegal Senegal |
153,018.52 | 9.73 | 8,556 | 17.884 |
 Algeria Algeria |
148,598.9 | 3.493 | 4,570 | 32.516 |
 Tajikistan Tajikistan |
148,125.37 | 16.586 | 3,271 | 45.284 |
 Pakistan Pakistan |
144,529 | 0.716 | 4,757 | 30.382 |
 Kyrgyzstan Kyrgyzstan |
141,538 | 22.433 | 6,045 | 23.414 |
 Macedonia Macedonia |
136,232 | 65.644 | 4,816 | 28.287 |
 Philippines Philippines |
128,227.01 | 1.205 | 7,893 | 16.246 |
 Azerbaijan Azerbaijan |
125,158.2 | 12.645 | 3,582 | 34.941 |
 Belgium Belgium |
106,710 | 9.347 | 3,790 | 28.156 |
 Venezuela Venezuela |
102,040.84 | 3.206 | 3,640 | 28.033 |
 Sri Lanka Sri Lanka |
100,084 | 4.667 | 4,342 | 23.05 |
 Guatemala Guatemala |
95,421.64 | 5.515 | 3,782 | 25.23 |
 Mali Mali |
94,177 | 4.929 | 4,972 | 18.941 |
 Morocco Morocco |
91,120 | 2.62 | 2,995 | 30.424 |
 Malaysia Malaysia |
90,726.5 | 2.778 | 3,725 | 24.356 |
 Honduras Honduras |
87,611.55 | 9.721 | 2,620 | 33.44 |
 Tanzania Tanzania |
85,068.09 | 1.57 | 7,430 | 11.449 |
 Rwanda Rwanda |
77,070.72 | 6.422 | 5,376 | 14.336 |
 Nicaragua Nicaragua |
71,945.61 | 11.448 | 1,250 | 57.556 |
 Albania Albania |
68,705.2 | 23.936 | 1,948 | 35.27 |
 Armenia Armenia |
64,257.1 | 21.637 | 1,630 | 39.422 |
 Turkmenistan Turkmenistan |
63,774.11 | 10.899 | 3,925 | 16.248 |
 Cameroon Cameroon |
63,256.18 | 2.658 | 2,504 | 25.262 |
 Australia Australia |
62,848 | 2.509 | 1,981 | 31.725 |
 Chile Chile |
62,240.32 | 3.542 | 2,639 | 23.585 |
 Lebanon Lebanon |
59,166.89 | 9.71 | 1,602 | 36.933 |
 New Zealand New Zealand |
58,118.16 | 11.858 | 763 | 76.171 |
 Syria Syria |
56,564 | 3.094 | 2,617 | 21.614 |
 Austria Austria |
56,360 | 6.377 | 1,200 | 46.967 |
 Jordan Jordan |
56,095 | 5.483 | 1,155 | 48.567 |
 Cuba Cuba |
54,449.36 | 4.852 | 2,362 | 23.052 |
 Israel Israel |
53,670 | 6.025 | 4,758 | 11.28 |
 Lithuania Lithuania |
51,300 | 18.317 | 1,550 | 33.097 |
 Dominican Republic Dominican Republic |
50,336 | 4.903 | 885 | 56.877 |
 Czech Republic Czech Republic |
47,720 | 4.496 | 1,220 | 39.115 |
 Jamaica Jamaica |
46,935 | 17.199 | 2,668 | 17.592 |
 Hungary Hungary |
46,340 | 4.743 | 1,910 | 24.262 |
 Mongolia Mongolia |
45,846.32 | 14.22 | 1,886 | 24.309 |
 Bulgaria Bulgaria |
44,960 | 6.377 | 1,850 | 24.303 |
 Colombia Colombia |
41,961 | 0.84 | 1,304 | 32.179 |
 Greece Greece |
40,580 | 3.769 | 1,620 | 25.049 |
 Switzerland Switzerland |
32,711 | 3.852 | 1,111 | 29.443 |
 Peru Peru |
32,640.61 | 1.045 | 2,386 | 13.68 |
 Norway Norway |
31,045 | 5.844 | 1,368 | 22.694 |
 Croatia Croatia |
30,190 | 7.202 | 1,260 | 23.96 |
 Tunisia Tunisia |
30,189.6 | 2.637 | 2,689 | 11.227 |
 Bosnia and Herzegovina Bosnia and Herzegovina |
29,115 | 7.693 | 1,294 | 22.5 |
 Denmark Denmark |
28,910 | 4.993 | 1,000 | 28.91 |
 United Arab Emirates United Arab Emirates |
27,623.18 | 2.895 | 502 | 55.026 |
 Sweden Sweden |
26,510 | 2.606 | 950 | 27.905 |
 Oman Oman |
25,997 | 5.188 | 767 | 33.894 |
 Vanuatu Vanuatu |
25,960 | 85.255 | 1,730 | 15.006 |
 Finland Finland |
25,380 | 4.6 | 630 | 40.286 |
 Latvia Latvia |
24,330 | 12.634 | 700 | 34.757 |
 Palestinian Territories Palestinian Territories |
21,674.8 | 4.764 | 806 | 26.892 |
 Congo-Kinshasa Congo-Kinshasa |
20,509.56 | 0.252 | 1,187 | 17.278 |
 Ireland Ireland |
20,210 | 4.161 | 830 | 24.349 |
 Costa Rica Costa Rica |
19,391.1 | 3.876 | 605 | 32.051 |
 Madagascar Madagascar |
18,230.43 | 0.694 | 884 | 20.623 |
 Saudi Arabia Saudi Arabia |
17,518.19 | 0.524 | 903 | 19.4 |
 Moldova Moldova |
17,439 | 4.911 | 1,732 | 10.069 |
 Haiti Haiti |
17,323.48 | 1.559 | 2,727 | 6.353 |
 Georgia Georgia |
16,800 | 4.505 | 600 | 28 |
 Slovenia Slovenia |
15,270 | 7.388 | 620 | 24.629 |
 Nepal Nepal |
13,576.52 | 0.465 | 494 | 27.483 |
 Mauritius Mauritius |
13,124 | 10.376 | 361 | 36.355 |
 Ecuador Ecuador |
12,380.04 | 0.725 | 2,038 | 6.075 |
 Guyana Guyana |
11,587.49 | 14.813 | 154 | 75.243 |
 Fiji Fiji |
10,172.4 | 11.496 | 678 | 15.004 |
 Montenegro Montenegro |
9,637.19 | 15.485 | 275 | 35.044 |
 Yemen Yemen |
7,480.04 | 0.259 | 586 | 12.765 |
 Slovakia Slovakia |
7,420 | 1.363 | 280 | 26.5 |
 Iraq Iraq |
7,266 | 0.185 | 779 | 9.327 |
 Namibia Namibia |
6,029.66 | 2.498 | 182 | 33.13 |
 Kuwait Kuwait |
5,690 | 1.346 | 112 | 50.804 |
 Botswana Botswana |
4,956.85 | 2.152 | 384 | 12.908 |
 Libya Libya |
4,846.04 | 0.749 | 327 | 14.82 |
 Bolivia Bolivia |
4,823.1 | 0.427 | 594 | 8.12 |
 Qatar Qatar |
3,965 | 1.618 | 124 | 31.976 |
 Uruguay Uruguay |
3,839.74 | 1.095 | 401 | 9.575 |
 Cyprus Cyprus |
3,730 | 4.364 | 100 | 37.3 |
 Malta Malta |
3,705 | 7.789 | 263 | 14.087 |
 Cape Verde Cape Verde |
3,405.91 | 6.26 | 195 | 17.466 |
 Panama Panama |
2,978.41 | 0.716 | 178 | 16.733 |
 Sudan Sudan |
2,962.69 | 0.073 | 400 | 7.407 |
 Bhutan Bhutan |
2,763.22 | 3.8 | 558 | 4.952 |
 East Timor East Timor |
2,720.46 | 2.157 | 233 | 11.676 |
 Congo-Brazzaville Congo-Brazzaville |
1,680.23 | 0.311 | 112 | 15.002 |
 The Bahamas The Bahamas |
1,533.09 | 4.02 | 57 | 26.896 |
 Luxembourg Luxembourg |
1,510 | 2.508 | 30 | 50.333 |
 Belize Belize |
1,333 | 3.367 | 61 | 21.852 |
 Bahrain Bahrain |
1,200 | 0.802 | 25 | 48 |
 Trinidad and Tobago Trinidad and Tobago |
987 | 0.728 | 59 | 16.729 |
 São Tomé and Príncipe São Tomé and Príncipe |
853.25 | 4.316 | 55 | 15.514 |
 Togo Togo |
828.36 | 0.113 | 74 | 11.194 |
 El Salvador El Salvador |
699.74 | 0.105 | 81 | 8.639 |
 Singapore Singapore |
665.58 | 0.119 | 34 | 19.576 |
 Suriname Suriname |
596.78 | 1.05 | 23 | 25.947 |
 Dominica Dominica |
463.63 | 6.503 | 46 | 10.079 |
 Grenada Grenada |
440 | 4.258 | 44 | 10 |
 Barbados Barbados |
310.36 | 1.084 | 14 | 22.169 |
 Iceland Iceland |
240 | 0.68 | 40 | 6 |
 Saint Lucia Saint Lucia |
118 | 0.66 | 5 | 23.6 |
 Antigua and Barbuda Antigua and Barbuda |
10.08 | 0.117 | 2 | 5.04 |
 Saint Kitts and Nevis Saint Kitts and Nevis |
9 | 0.195 | 1 | 9 |
 Djibouti Djibouti |
7.9 | 0.008 | 1 | 7.9 |
 Nauru Nauru |
1.09 | 0.108 | 0 | ∞ |
Top Cabbage Producing Countries by Share
- China alone contributes approximately 47.5% of the world's cabbage production, dominating the global market.
- India accounts for about 13.6%, highlighting its role as a significant producer.
- With a share of 3.48%, the Russian Federation holds a solid position among the top producers.
- South Korea's share stands at 3.32%, further emphasizing the dominance of Asian countries in cabbage production.
- Despite Canada's lower ranking, its contribution is noteworthy for the North American region.