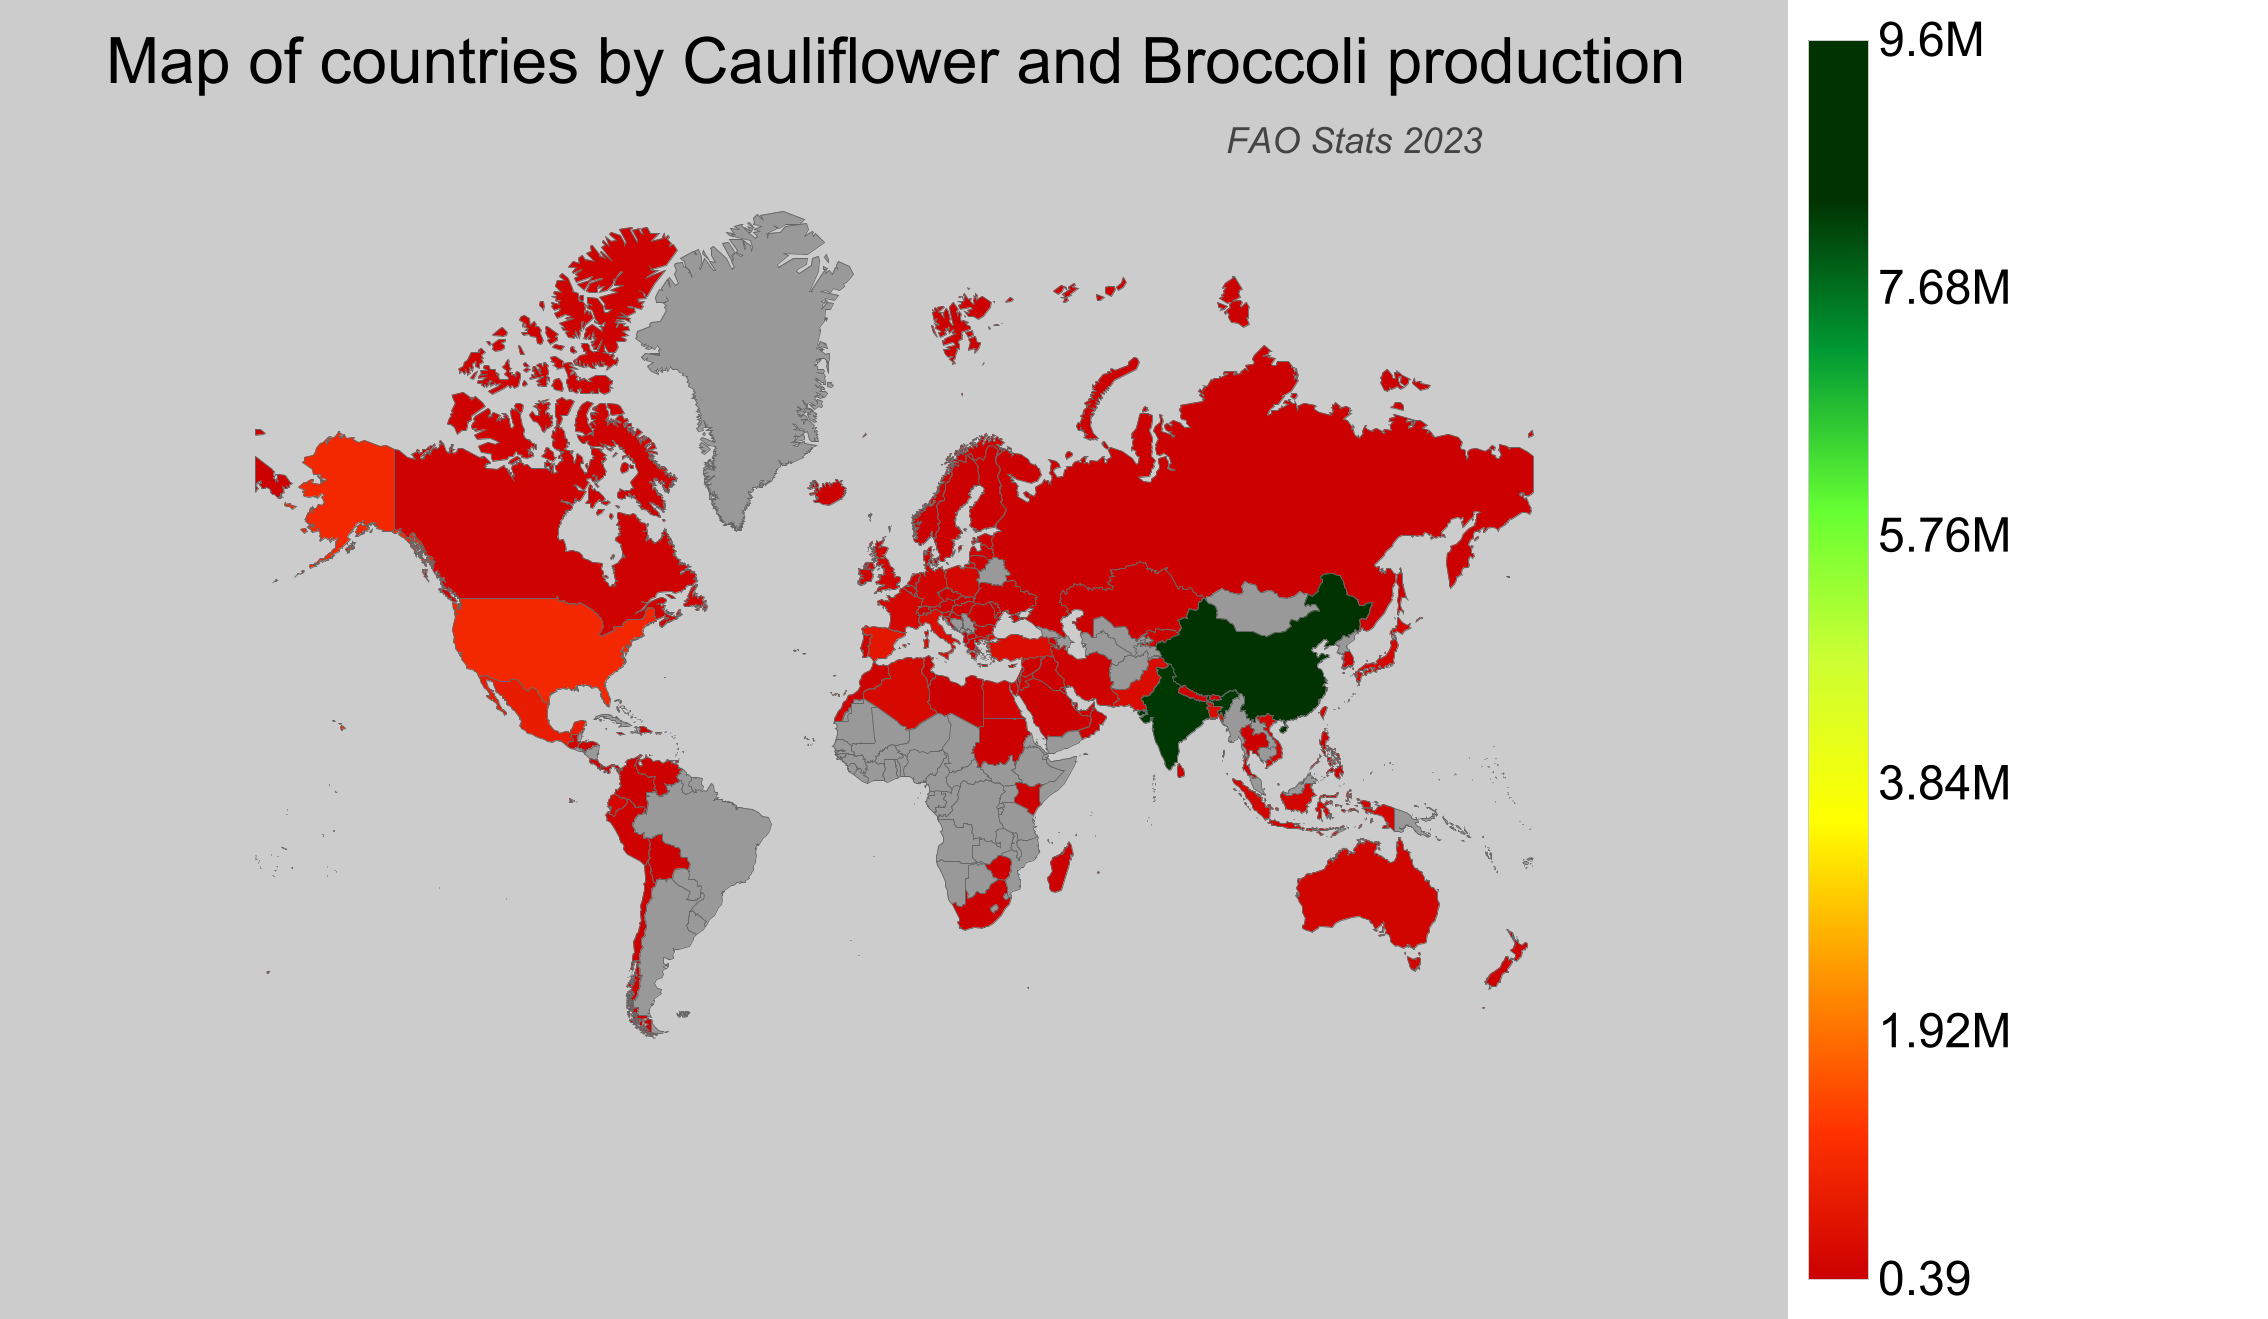
Countries by Cauliflower and Broccoli production
Cauliflower and Broccoli are essential vegetables in the global agriculture market, prized for their nutritional benefits and versatility in various cuisines. These vegetables flourish in temperate climates and are significant cash crops in regions with adequate rainfall and cooler temperatures. As of 2025, the latest available data for the year 2023 from the Food and Agriculture Organization (FAO) highlights global production trends and provides insights into significant production shifts.
Global Cauliflower and Broccoli Production
In 2023, global production of Cauliflower and Broccoli reached approximately 26.5 million tonnes. Since 1961, production has exhibited a strong upward trend, increasing by over 23 million tonnes from the initial 3.5 million tonnes. Significant milestones include substantial growth in the 1990s and 2000s, with production nearly doubling from 1990 to 2000. Over the past decade, production has continued to rise steadily, reflecting ongoing demand and cultivation expansion globally.
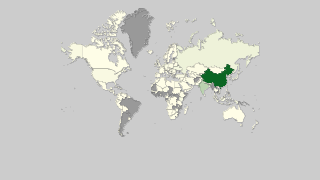
Cauliflower and Broccoli Production by Country
- China leads global production with around 9.6 million tonnes, demonstrating its significant contribution to the global supply of Cauliflower and Broccoli.
- India closely follows China with a production of about 9.5 million tonnes, showcasing its competitive edge in the agriculture sector.
- The United States of America produced approximately 1.1 million tonnes, emphasizing its role as a major producer in North America.
- Mexico contributes about 768,000 tonnes, marking its importance as a key exporter in the region.
- Canada, while not among the top global producers, had an output of around 63,000 tonnes, ranking 27th according to FAO statistics.
| Country | Production (tonnes) | Production per Person (kg) | Harvested Area (ha) | Yield (kg/ha) |
|---|---|---|---|---|
 China China |
9,606,911.02 | 6.892 | 484,031 | 19.848 |
 India India |
9,548,000 | 7.144 | 491,000 | 19.446 |
 United States of America United States of America |
1,056,734 | 3.224 | 62,605 | 16.879 |
 Mexico Mexico |
768,353.55 | 6.16 | 41,722 | 18.416 |
 Spain Spain |
637,080 | 13.654 | 39,630 | 16.076 |
 Turkey Turkey |
367,566 | 4.305 | 14,157 | 25.964 |
 Italy Italy |
355,200 | 5.877 | 14,720 | 24.13 |
 Pakistan Pakistan |
346,929 | 1.719 | 12,653 | 27.419 |
 Bangladesh Bangladesh |
343,758 | 2.082 | 22,853 | 15.042 |
 Algeria Algeria |
268,699.96 | 6.316 | 9,594 | 28.007 |
 France France |
208,660 | 3.101 | 15,320 | 13.62 |
 Poland Poland |
205,900 | 5.357 | 10,100 | 20.386 |
 Ecuador Ecuador |
197,220.56 | 11.556 | 9,850 | 20.022 |
 Japan Japan |
195,680.07 | 1.547 | 18,611 | 10.514 |
 Vietnam Vietnam |
186,804.11 | 1.973 | 9,165 | 20.382 |
 Indonesia Indonesia |
175,072.73 | 0.661 | 13,534 | 12.936 |
 Australia Australia |
161,209 | 6.436 | 15,043 | 10.717 |
 Belgium Belgium |
141,620 | 12.405 | 6,460 | 21.923 |
 United Kingdom United Kingdom |
134,327.77 | 2.034 | 16,219 | 8.282 |
 Germany Germany |
126,020 | 1.523 | 5,930 | 21.251 |
 Guatemala Guatemala |
118,833.9 | 6.868 | 7,035 | 16.892 |
 Egypt Egypt |
116,611.36 | 1.196 | 5,604 | 20.809 |
 The Netherlands The Netherlands |
75,880 | 4.399 | 4,920 | 15.423 |
 Taiwan Taiwan |
69,392 | 2.943 | 3,153 | 22.008 |
 Jordan Jordan |
66,647 | 6.514 | 1,589 | 41.943 |
 Morocco Morocco |
64,385 | 1.851 | 2,341 | 27.503 |
 Canada Canada |
62,597 | 1.682 | 5,215 | 12.003 |
 Peru Peru |
59,944.53 | 1.919 | 4,234 | 14.158 |
 Iran Iran |
59,776.77 | 0.731 | 1,844 | 32.417 |
 Portugal Portugal |
56,270 | 5.468 | 3,740 | 15.045 |
 Syria Syria |
38,803 | 2.122 | 2,063 | 18.809 |
 Greece Greece |
38,290 | 3.556 | 2,040 | 18.77 |
 New Zealand New Zealand |
32,887.27 | 6.71 | 2,393 | 13.743 |
 Venezuela Venezuela |
31,748.5 | 0.997 | 1,419 | 22.374 |
 Palestinian Territories Palestinian Territories |
30,537.25 | 6.711 | 871 | 35.06 |
 Chile Chile |
27,302.44 | 1.554 | 1,887 | 14.469 |
 Israel Israel |
27,130 | 3.046 | 3,414 | 7.947 |
 Russian Federation Russian Federation |
22,824.96 | 0.155 | 2,061 | 11.075 |
 Oman Oman |
22,648 | 4.52 | 1,057 | 21.427 |
 Saudi Arabia Saudi Arabia |
22,102.38 | 0.661 | 1,126 | 19.629 |
 Colombia Colombia |
21,814.65 | 0.437 | 1,141 | 19.119 |
 Romania Romania |
21,380 | 1.095 | 1,750 | 12.217 |
 Lebanon Lebanon |
16,208.93 | 2.66 | 716 | 22.638 |
 Thailand Thailand |
15,193.32 | 0.22 | 1,153 | 13.177 |
 Philippines Philippines |
13,819.25 | 0.13 | 1,360 | 10.161 |
 Switzerland Switzerland |
12,033 | 1.417 | 1,492 | 8.065 |
 United Arab Emirates United Arab Emirates |
11,416.93 | 1.197 | 350 | 32.62 |
 Norway Norway |
10,620 | 1.999 | 918 | 11.569 |
 Ukraine Ukraine |
10,490 | 0.248 | 800 | 13.113 |
 South Africa South Africa |
10,468 | 0.181 | 942 | 11.113 |
 Tunisia Tunisia |
10,384.24 | 0.907 | 933 | 11.13 |
 Ireland Ireland |
9,000 | 1.853 | 760 | 11.842 |
 Iraq Iraq |
8,993 | 0.229 | 804 | 11.185 |
 Sweden Sweden |
8,120 | 0.798 | 800 | 10.15 |
 Armenia Armenia |
7,876.6 | 2.652 | 232 | 33.951 |
 Libya Libya |
7,767.51 | 1.2 | 914 | 8.498 |
 Albania Albania |
7,373.5 | 2.569 | 355 | 20.77 |
 Denmark Denmark |
7,340 | 1.268 | 740 | 9.919 |
 Austria Austria |
7,280 | 0.824 | 340 | 21.412 |
 Kuwait Kuwait |
7,062 | 1.671 | 182 | 38.802 |
 Dominican Republic Dominican Republic |
6,690 | 0.652 | 711 | 9.409 |
 Hungary Hungary |
6,260 | 0.641 | 260 | 24.077 |
 Malta Malta |
6,059 | 12.737 | 325 | 18.643 |
 Czech Republic Czech Republic |
4,410 | 0.416 | 270 | 16.333 |
 Finland Finland |
3,580 | 0.649 | 440 | 8.136 |
 Jamaica Jamaica |
2,998 | 1.099 | 269 | 11.145 |
 Mauritius Mauritius |
2,327 | 1.84 | 133 | 17.496 |
 Qatar Qatar |
2,152 | 0.878 | 86 | 25.023 |
 Bulgaria Bulgaria |
2,130 | 0.302 | 160 | 13.312 |
 Croatia Croatia |
2,120 | 0.506 | 140 | 15.143 |
 Nepal Nepal |
2,093.56 | 0.072 | 111 | 18.861 |
 Sri Lanka Sri Lanka |
1,888 | 0.088 | 268 | 7.045 |
 Estonia Estonia |
1,850 | 1.402 | 220 | 8.409 |
 Bhutan Bhutan |
1,745.08 | 2.4 | 564 | 3.094 |
 Kazakhstan Kazakhstan |
1,596.02 | 0.087 | 73 | 21.863 |
 Kyrgyzstan Kyrgyzstan |
1,358.6 | 0.215 | 311 | 4.368 |
 Cyprus Cyprus |
1,210 | 1.416 | 60 | 20.167 |
 Lithuania Lithuania |
1,200 | 0.428 | 160 | 7.5 |
 Slovenia Slovenia |
1,100 | 0.532 | 80 | 13.75 |
 Honduras Honduras |
1,051.66 | 0.117 | 132 | 7.967 |
 Kenya Kenya |
1,025.75 | 0.02 | 105 | 9.769 |
 Moldova Moldova |
983.4 | 0.277 | 88 | 11.175 |
 Panama Panama |
973.11 | 0.234 | 52 | 18.714 |
 Bahrain Bahrain |
950 | 0.635 | 22 | 43.182 |
 Bolivia Bolivia |
814.24 | 0.072 | 123 | 6.62 |
 Sudan Sudan |
758.94 | 0.019 | 36 | 21.082 |
 Macedonia Macedonia |
514 | 0.248 | 46 | 11.174 |
 Costa Rica Costa Rica |
369.77 | 0.074 | 52 | 7.111 |
 Slovakia Slovakia |
350 | 0.064 | 30 | 11.667 |
 Latvia Latvia |
340 | 0.177 | 60 | 5.667 |
 Zimbabwe Zimbabwe |
287.51 | 0.019 | 19 | 15.132 |
 Madagascar Madagascar |
273.28 | 0.01 | 32 | 8.54 |
 Grenada Grenada |
130 | 1.258 | 23 | 5.652 |
 Iceland Iceland |
123 | 0.348 | 10 | 12.3 |
 South Korea South Korea |
87.37 | 0.002 | 8 | 10.921 |
 Trinidad and Tobago Trinidad and Tobago |
78 | 0.057 | 37 | 2.108 |
 Luxembourg Luxembourg |
70 | 0.116 | 0 | ∞ |
 Nauru Nauru |
0.39 | 0.039 | 0 | ∞ |
Top Cauliflower and Broccoli Producing Countries by Share
- China alone accounts for over 36.3% of global production, highlighting its dominant position in the market.
- India's production makes up about 36.1% of the world’s supply, reflecting its significant share alongside China.
- Combined, China and India produce over 72% of the global total, underscoring their overwhelming influence on worldwide production levels.
- The United States contributes nearly 4% of global production, showcasing its role as a major producer in the Western Hemisphere.
- While Canada's share is approximately 0.24%, it maintains a niche presence in the global market, participating in the regional supply chain.