Countries by Carrot and Turnip production
Carrots and turnips are staple vegetables that play a crucial role in diets worldwide. These crops thrive in temperate climates and are integral to agricultural production, providing essential nutrients and vitamins. As of 2025, the latest data from the Food and Agriculture Organization (FAO) for the year 2023 highlights global production trends. Understanding these numbers is key for stakeholders in agriculture, trade, and nutrition sectors.
Global Carrot and Turnip Production
In 2023, the global production of carrots and turnips reached approximately 41.4 million tonnes. From 1961 to 2023, there has been a substantial increase in production, from about 5.8 million tonnes to 41.4 million tonnes, indicating significant growth. China has led this surge in production, with its output forming a major portion of the global production. Over the decades, global production has risen consistently, showcasing improvements in agricultural practices and production efficiency.
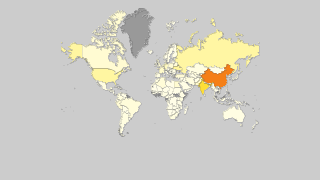
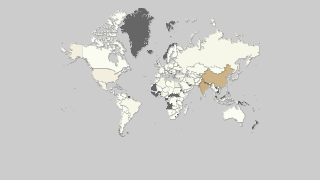
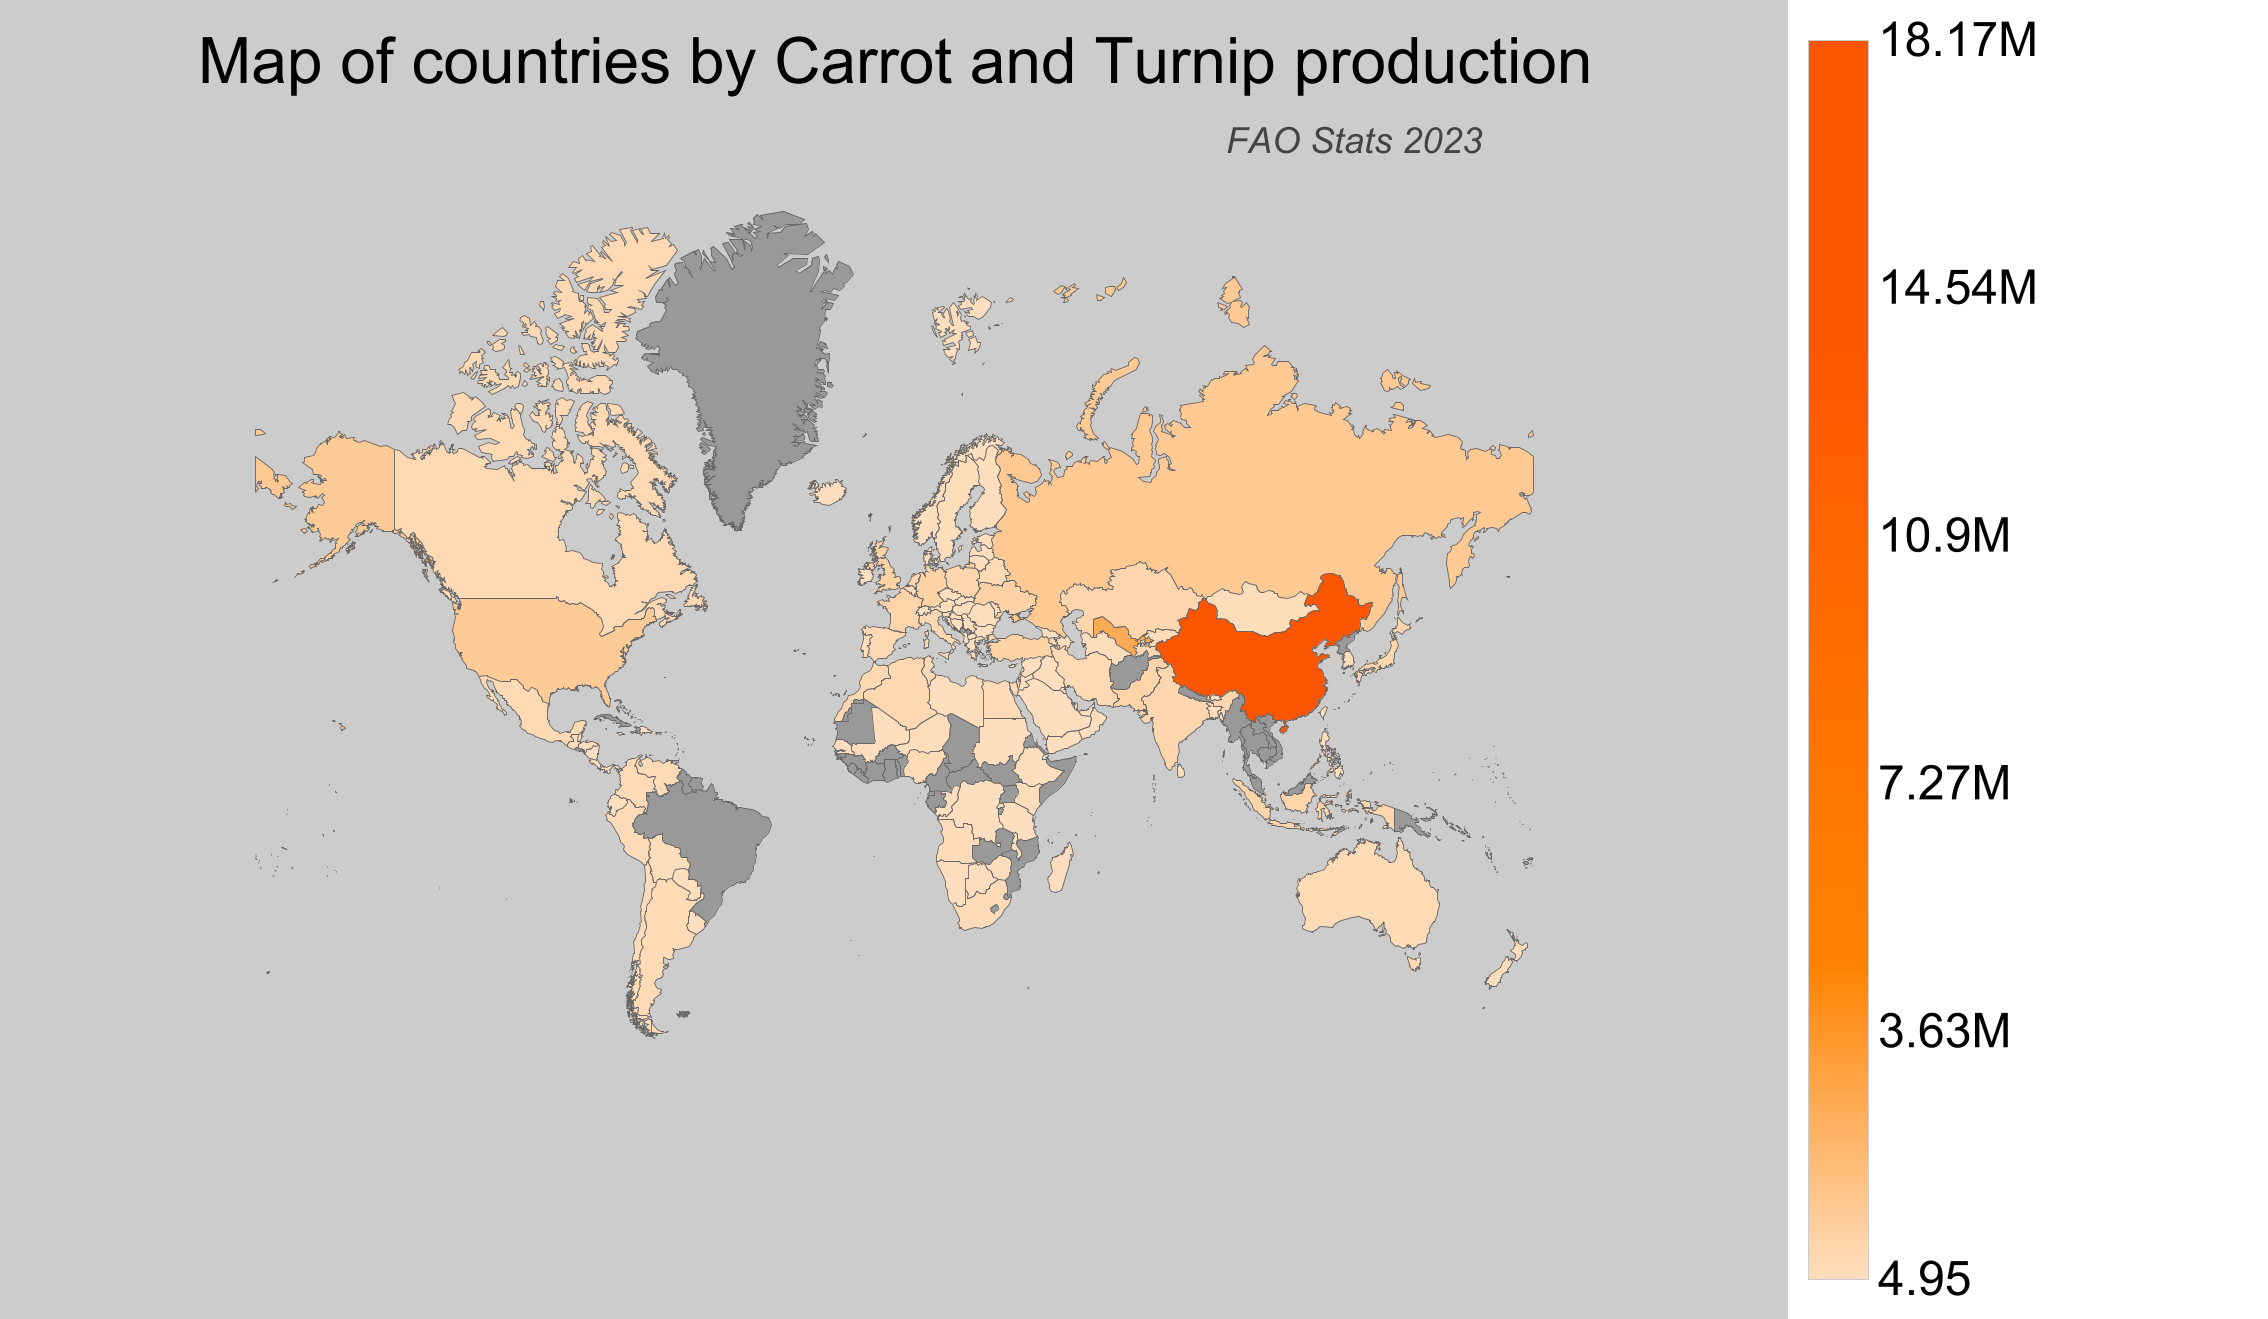
Carrot and Turnip Production by Country
- China is the leading producer, contributing around 18.2 million tonnes of carrots and turnips in 2023, showcasing its dominance in the sector.
- Uzbekistan follows with a substantial production of around 3.45 million tonnes, reflecting its robust agricultural output.
- The Russian Federation produced approximately 1.4 million tonnes, contributing notably to the global supply.
- In the United States of America, production reached about 1.33 million tonnes, highlighting its significant role in agriculture.
- Canada, with its production of around 338,000 tonnes, ranks 23rd globally. Although not among the top producers, Canada's role is vital for its domestic market.
| Country | Production (tonnes) | Production per Person (kg) | Harvested Area (ha) | Yield (kg/ha) |
|---|---|---|---|---|
 China China |
18,175,607.23 | 13.04 | 395,525 | 45.953 |
 Uzbekistan Uzbekistan |
3,449,621.89 | 105.642 | 40,873 | 84.399 |
 Russian Federation Russian Federation |
1,403,028.77 | 9.552 | 43,388 | 32.337 |
 United States of America United States of America |
1,331,702 | 4.063 | 26,629 | 50.009 |
 Ukraine Ukraine |
844,410 | 19.979 | 40,700 | 20.747 |
 United Kingdom United Kingdom |
822,761.72 | 12.458 | 13,987 | 58.823 |
 Germany Germany |
796,750 | 9.629 | 13,490 | 59.062 |
 Turkey Turkey |
780,294 | 9.14 | 13,759 | 56.712 |
 Pakistan Pakistan |
720,850 | 3.571 | 26,381 | 27.325 |
 Indonesia Indonesia |
668,177.95 | 2.521 | 34,613 | 19.304 |
 France France |
629,630 | 9.356 | 15,110 | 41.67 |
 Japan Japan |
578,163.61 | 4.571 | 16,449 | 35.149 |
 Poland Poland |
577,400 | 15.023 | 15,000 | 38.493 |
 India India |
558,047.62 | 0.418 | 36,206 | 15.413 |
 Kazakhstan Kazakhstan |
557,078.99 | 30.487 | 19,632 | 28.376 |
 The Netherlands The Netherlands |
485,950 | 28.169 | 7,760 | 62.622 |
 Algeria Algeria |
436,621.07 | 10.262 | 16,109 | 27.104 |
 Italy Italy |
435,410 | 7.204 | 9,490 | 45.881 |
 Tajikistan Tajikistan |
432,692.39 | 48.448 | 9,789 | 44.202 |
 Morocco Morocco |
404,646 | 11.636 | 13,669 | 29.603 |
 Spain Spain |
388,060 | 8.317 | 6,820 | 56.9 |
 Mexico Mexico |
350,452.1 | 2.81 | 11,726 | 29.887 |
 Canada Canada |
337,810 | 9.078 | 8,019 | 42.126 |
 Iran Iran |
328,381.76 | 4.017 | 12,491 | 26.289 |
 Belarus Belarus |
326,549.11 | 34.453 | 8,756 | 37.294 |
 Argentina Argentina |
302,535.34 | 6.799 | 9,103 | 33.235 |
 Australia Australia |
300,715 | 12.005 | 5,045 | 59.607 |
 Colombia Colombia |
273,337.29 | 5.475 | 9,397 | 29.088 |
 Egypt Egypt |
266,978.58 | 2.738 | 9,255 | 28.847 |
 Nigeria Nigeria |
236,900.85 | 1.2 | 26,500 | 8.94 |
 Venezuela Venezuela |
230,781.37 | 7.251 | 10,071 | 22.915 |
 Belgium Belgium |
225,000 | 19.708 | 4,200 | 53.571 |
 South Africa South Africa |
213,141 | 3.692 | 7,183 | 29.673 |
 Peru Peru |
210,341 | 6.734 | 10,085 | 20.857 |
 Tunisia Tunisia |
209,147.22 | 18.272 | 12,068 | 17.331 |
 Kyrgyzstan Kyrgyzstan |
184,378 | 29.223 | 8,015 | 23.004 |
 Israel Israel |
160,396 | 18.006 | 2,173 | 73.813 |
 Angola Angola |
159,173 | 5.442 | 8,632 | 18.44 |
 Chile Chile |
158,569.96 | 9.023 | 3,213 | 49.353 |
 Guatemala Guatemala |
131,036.11 | 7.573 | 5,126 | 25.563 |
 Portugal Portugal |
125,540 | 12.199 | 2,240 | 56.045 |
 Austria Austria |
121,040 | 13.695 | 1,920 | 63.042 |
 Kenya Kenya |
119,031.63 | 2.336 | 6,326 | 18.816 |
 Mongolia Mongolia |
111,158.7 | 34.478 | 9,187 | 12.1 |
 Sweden Sweden |
108,240 | 10.641 | 1,740 | 62.207 |
 Bolivia Bolivia |
96,767.71 | 8.558 | 6,967 | 13.889 |
 Taiwan Taiwan |
87,024 | 3.691 | 1,757 | 49.53 |
 Romania Romania |
81,980 | 4.199 | 6,910 | 11.864 |
 Niger Niger |
79,473.26 | 3.702 | 2,915 | 27.264 |
 Zimbabwe Zimbabwe |
78,287.38 | 5.272 | 3,330 | 23.51 |
 New Zealand New Zealand |
77,295.11 | 15.771 | 1,714 | 45.096 |
 Denmark Denmark |
75,850 | 13.1 | 2,110 | 35.948 |
 South Korea South Korea |
74,545.12 | 1.444 | 2,049 | 36.381 |
 Turkmenistan Turkmenistan |
73,092.96 | 12.491 | 2,176 | 33.591 |
 Hungary Hungary |
72,350 | 7.405 | 1,610 | 44.938 |
 Philippines Philippines |
69,594.02 | 0.654 | 5,586 | 12.459 |
 Dominican Republic Dominican Republic |
69,041.83 | 6.725 | 2,409 | 28.66 |
 Sri Lanka Sri Lanka |
65,352 | 3.048 | 3,510 | 18.619 |
 Finland Finland |
64,310 | 11.655 | 1,640 | 39.213 |
 Ireland Ireland |
60,860 | 12.53 | 900 | 67.622 |
 Switzerland Switzerland |
50,203 | 5.911 | 2,223 | 22.583 |
 Rwanda Rwanda |
46,411.96 | 3.867 | 4,299 | 10.796 |
 Bangladesh Bangladesh |
46,192 | 0.28 | 4,140 | 11.157 |
 Sudan Sudan |
46,011.62 | 1.128 | 8,093 | 5.685 |
 Norway Norway |
45,284 | 8.524 | 1,533 | 29.539 |
 Serbia Serbia |
44,380.16 | 6.339 | 2,816 | 15.76 |
 Ecuador Ecuador |
42,975.68 | 2.518 | 6,831 | 6.291 |
 Libya Libya |
34,582.14 | 5.344 | 8,010 | 4.317 |
 Azerbaijan Azerbaijan |
33,733.2 | 3.408 | 980 | 34.422 |
 Jamaica Jamaica |
33,292 | 12.2 | 2,154 | 15.456 |
 Czech Republic Czech Republic |
32,560 | 3.068 | 840 | 38.762 |
 Moldova Moldova |
28,070 | 7.905 | 2,704 | 10.381 |
 Senegal Senegal |
27,982.39 | 1.779 | 3,514 | 7.963 |
 Jordan Jordan |
27,087 | 2.648 | 493 | 54.943 |
 Uruguay Uruguay |
26,225.14 | 7.48 | 1,145 | 22.904 |
 Saudi Arabia Saudi Arabia |
24,710.41 | 0.74 | 1,368 | 18.063 |
 Syria Syria |
22,526 | 1.232 | 950 | 23.712 |
 Nicaragua Nicaragua |
22,089.74 | 3.515 | 909 | 24.301 |
 Lithuania Lithuania |
21,360 | 7.627 | 1,160 | 18.414 |
 Ethiopia Ethiopia |
19,916.17 | 0.185 | 5,737 | 3.472 |
 Oman Oman |
19,261 | 3.844 | 442 | 43.577 |
 Slovakia Slovakia |
19,080 | 3.505 | 490 | 38.939 |
 Mali Mali |
18,697 | 0.979 | 1,170 | 15.98 |
 Costa Rica Costa Rica |
17,587.2 | 3.515 | 603 | 29.166 |
 Greece Greece |
17,010 | 1.58 | 770 | 22.091 |
 Armenia Armenia |
16,662.2 | 5.611 | 739 | 22.547 |
 Albania Albania |
16,122.2 | 5.617 | 425 | 37.935 |
 Yemen Yemen |
15,396.27 | 0.532 | 1,673 | 9.203 |
 Paraguay Paraguay |
12,247.94 | 1.737 | 725 | 16.894 |
 Estonia Estonia |
10,030 | 7.603 | 270 | 37.148 |
 Bulgaria Bulgaria |
9,710 | 1.377 | 450 | 21.578 |
 Madagascar Madagascar |
9,287.51 | 0.354 | 2,724 | 3.41 |
 Bosnia and Herzegovina Bosnia and Herzegovina |
8,674 | 2.292 | 830 | 10.451 |
 Latvia Latvia |
8,180 | 4.248 | 400 | 20.45 |
 Croatia Croatia |
7,800 | 1.861 | 400 | 19.5 |
 Mauritius Mauritius |
7,166 | 5.665 | 433 | 16.55 |
 Palestinian Territories Palestinian Territories |
5,655.63 | 1.243 | 198 | 28.564 |
 Honduras Honduras |
4,790.49 | 0.532 | 411 | 11.656 |
 Bhutan Bhutan |
4,645.18 | 6.388 | 637 | 7.292 |
 Macedonia Macedonia |
4,410 | 2.125 | 454 | 9.714 |
 Lebanon Lebanon |
4,211.93 | 0.691 | 284 | 14.831 |
 Malawi Malawi |
4,104.5 | 0.229 | 204 | 20.12 |
 Slovenia Slovenia |
3,950 | 1.911 | 190 | 20.789 |
 Iraq Iraq |
3,222 | 0.082 | 410 | 7.859 |
 Namibia Namibia |
2,756.64 | 1.142 | 93 | 29.641 |
 Cyprus Cyprus |
2,200 | 2.574 | 50 | 44 |
 Botswana Botswana |
2,142 | 0.93 | 44 | 48.682 |
 Panama Panama |
2,012.69 | 0.484 | 184 | 10.939 |
 Iceland Iceland |
1,667 | 4.721 | 20 | 83.35 |
 Tanzania Tanzania |
1,394.7 | 0.026 | 479 | 2.912 |
 Luxembourg Luxembourg |
1,310 | 2.176 | 30 | 43.667 |
 Cape Verde Cape Verde |
1,251.77 | 2.301 | 57 | 21.961 |
 United Arab Emirates United Arab Emirates |
1,157.15 | 0.121 | 61 | 18.97 |
 Malta Malta |
1,107 | 2.327 | 47 | 23.553 |
 São Tomé and Príncipe São Tomé and Príncipe |
983.12 | 4.973 | 145 | 6.78 |
 Georgia Georgia |
900 | 0.241 | 160 | 5.625 |
 Bahrain Bahrain |
620 | 0.414 | 7 | 88.571 |
 Dominica Dominica |
576.96 | 8.093 | 58 | 9.948 |
 Congo-Brazzaville Congo-Brazzaville |
505.44 | 0.094 | 79 | 6.398 |
 Congo-Kinshasa Congo-Kinshasa |
416.8 | 0.005 | 46 | 9.061 |
 Belize Belize |
402 | 1.015 | 34 | 11.824 |
 Qatar Qatar |
285 | 0.116 | 12 | 23.75 |
 Saint Vincent and the Grenadines Saint Vincent and the Grenadines |
239 | 2.182 | 27 | 8.852 |
 Barbados Barbados |
225.73 | 0.788 | 13 | 17.364 |
 Kuwait Kuwait |
116 | 0.027 | 4 | 29 |
 Grenada Grenada |
76 | 0.736 | 13 | 5.846 |
 Saint Kitts and Nevis Saint Kitts and Nevis |
63 | 1.364 | 7 | 9 |
 Vanuatu Vanuatu |
50 | 0.164 | 1 | 50 |
 Trinidad and Tobago Trinidad and Tobago |
35 | 0.026 | 1 | 35 |
 Djibouti Djibouti |
16.34 | 0.016 | 0 | ∞ |
 Saint Lucia Saint Lucia |
15 | 0.084 | 1 | 15 |
 Antigua and Barbuda Antigua and Barbuda |
4.95 | 0.057 | 0 | ∞ |
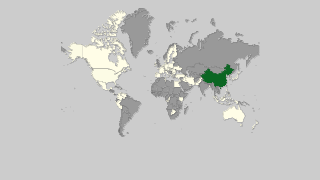
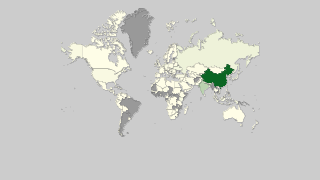
Top Carrot and Turnip Producing Countries by Share
- China leads with an impressive 43.9% of the global carrot and turnip production, underlining its agricultural prowess.
- Uzbekistan contributes 8.33%, marking its importance in the global market.
- The Russian Federation's share sits at 3.39%, demonstrating its substantial agricultural sector.
- The United States of America holds a 3.21% share of global production, making it a key player.
- Canada, despite its smaller share of 0.82%, continues to be a relevant contributor, especially within North America.