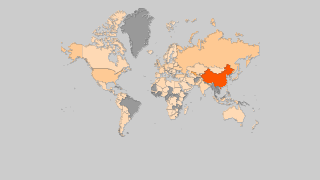
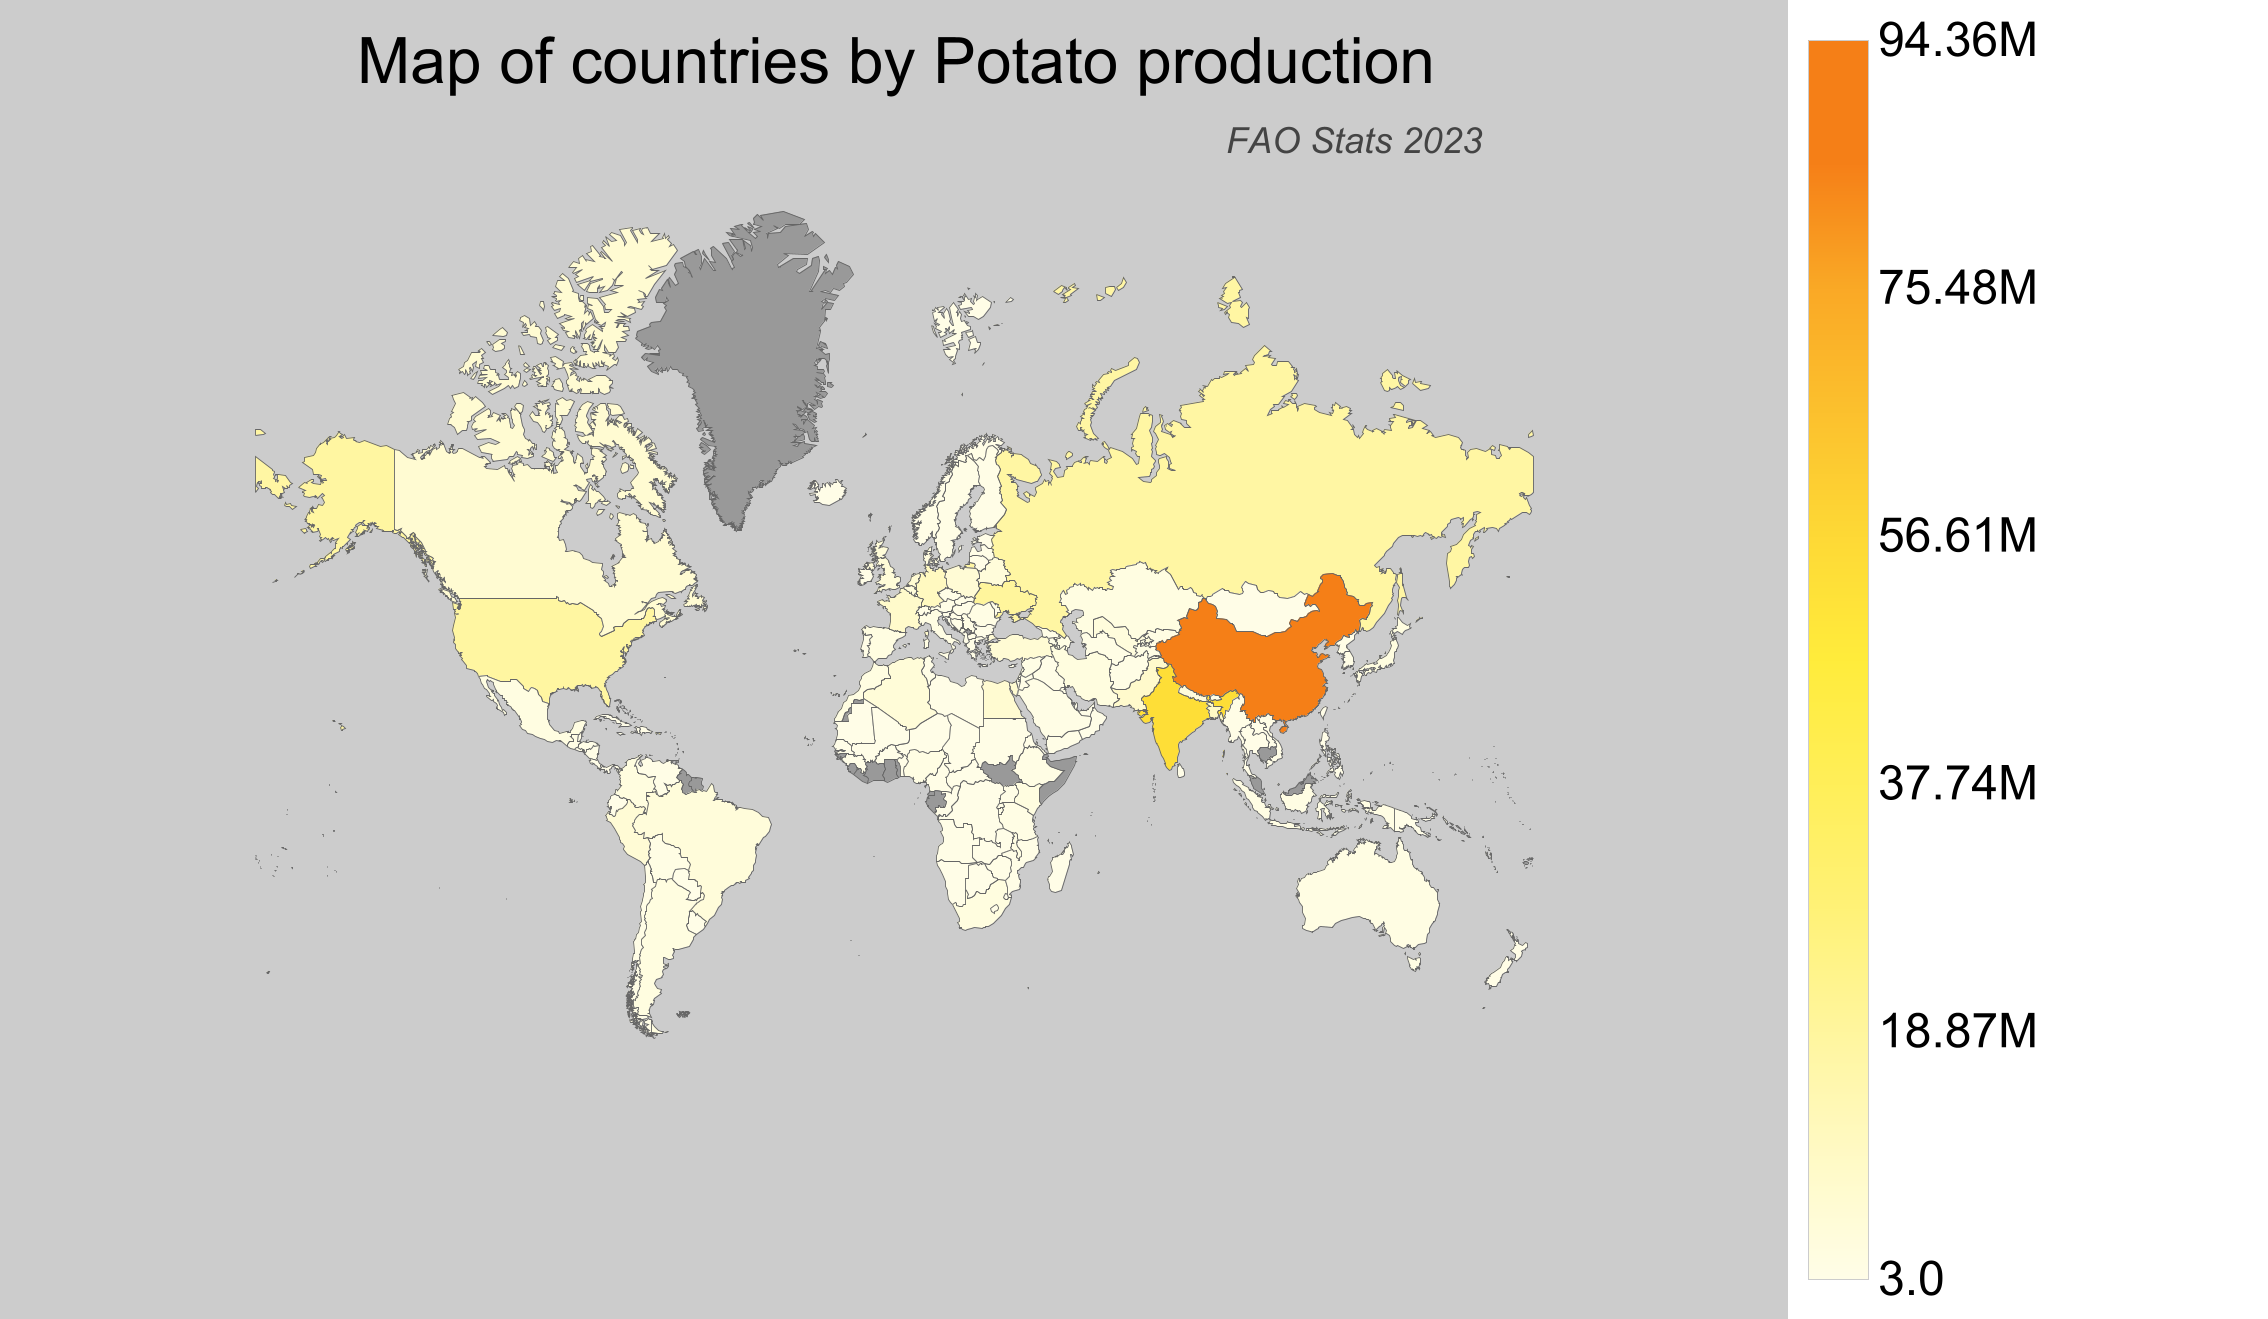
Countries by Potato production
Potatoes are a staple food for many cultures around the world, thanks to their versatility and nutritional value. They thrive in temperate climates, predominantly in regions with cool growing seasons, which are ideal for potato cultivation. According to the 2023 data from the FAO stats database, potatoes continue to be a significant crop globally, providing food security and economic benefits to many countries.
Global Potato Production
In 2023, global potato production reached approximately 383 million tonnes. Over the years, there has been a noticeable increase in production from around 271 million tonnes in 1961 to current levels. This growth reflects improved agricultural practices, technology, and the expanding need to support growing populations. Notably, there has been a nearly 42% increase in production from the initial data point, demonstrating significant global agricultural development.
Potato Production by Country
- China is the leading potato producer, with a staggering production of around 94 million tonnes.
- India follows, contributing roughly 60 million tonnes to the global potato supply.
- Ukraine has a significant share, with a production of about 21 million tonnes.
- The United States of America also contributes significantly with approximately 20 million tonnes.
- Canada, though not in the top ranks, produced around 6.5 million tonnes, reflecting its important yet modest contribution to the global market.
| Country | Production (tonnes) | Production per Person (kg) | Harvested Area (ha) | Yield (kg/ha) |
|---|---|---|---|---|
 China China |
94,362,175 | 67.698 | 5,782,738 | 16.318 |
 India India |
60,142,000 | 45 | 2,332,000 | 25.79 |
 Ukraine Ukraine |
21,358,630 | 505.364 | 1,210,200 | 17.649 |
 United States of America United States of America |
19,992,090 | 60.995 | 388,580 | 51.449 |
 Russian Federation Russian Federation |
19,374,440.76 | 131.909 | 1,105,425 | 17.527 |
 Germany Germany |
11,607,300 | 140.285 | 264,700 | 43.851 |
 Bangladesh Bangladesh |
10,431,736 | 63.174 | 455,523 | 22.901 |
 France France |
8,606,490 | 127.888 | 204,010 | 42.187 |
 Pakistan Pakistan |
8,319,767 | 41.213 | 340,576 | 24.429 |
 Egypt Egypt |
6,869,330.96 | 70.457 | 235,625 | 29.154 |
 Canada Canada |
6,543,393 | 175.833 | 156,642 | 41.773 |
 The Netherlands The Netherlands |
6,491,890 | 376.313 | 155,340 | 41.791 |
 Turkey Turkey |
5,700,000 | 66.766 | 150,927 | 37.767 |
 Poland Poland |
5,590,030 | 145.446 | 188,580 | 29.643 |
 Peru Peru |
5,445,215.85 | 174.317 | 314,301 | 17.325 |
 United Kingdom United Kingdom |
4,703,724 | 71.225 | 115,076 | 40.875 |
 Algeria Algeria |
4,632,151.71 | 108.874 | 137,747 | 33.628 |
 Brazil Brazil |
4,188,704 | 19.991 | 123,455 | 33.929 |
 Belgium Belgium |
4,021,930 | 352.284 | 95,700 | 42.026 |
 Belarus Belarus |
4,020,846 | 424.22 | 183,179 | 21.95 |
 Uzbekistan Uzbekistan |
3,574,060.41 | 109.453 | 112,119 | 31.877 |
 Nepal Nepal |
3,487,815.76 | 119.369 | 203,812 | 17.113 |
 Denmark Denmark |
2,757,200 | 476.204 | 61,100 | 45.126 |
 Colombia Colombia |
2,573,450.49 | 51.542 | 112,975 | 22.779 |
 Iran Iran |
2,483,198.83 | 30.373 | 80,559 | 30.825 |
 South Africa South Africa |
2,415,638 | 41.847 | 63,510 | 38.036 |
 Argentina Argentina |
2,365,997.52 | 53.175 | 65,767 | 35.975 |
 Kenya Kenya |
2,309,913 | 45.336 | 239,325 | 9.652 |
 Japan Japan |
2,180,065.94 | 17.235 | 69,679 | 31.287 |
 Kazakhstan Kazakhstan |
2,046,772.1 | 112.014 | 94,678 | 21.618 |
 Mexico Mexico |
1,986,198.81 | 15.923 | 62,124 | 31.972 |
 Spain Spain |
1,921,850 | 41.189 | 59,360 | 32.376 |
 Morocco Morocco |
1,822,864.8 | 52.419 | 58,581 | 31.117 |
 Malawi Malawi |
1,551,921.22 | 86.547 | 82,434 | 18.826 |
 Australia Australia |
1,462,975 | 58.404 | 34,774 | 42.071 |
 Kyrgyzstan Kyrgyzstan |
1,286,827 | 203.957 | 72,483 | 17.754 |
 Italy Italy |
1,265,450 | 20.939 | 45,450 | 27.843 |
 Indonesia Indonesia |
1,248,513.44 | 4.711 | 63,606 | 19.629 |
 Nigeria Nigeria |
1,218,233.09 | 6.171 | 322,768 | 3.774 |
 Ethiopia Ethiopia |
1,191,046.56 | 11.076 | 74,817 | 15.919 |
 Romania Romania |
1,183,470 | 60.616 | 79,490 | 14.888 |
 Bolivia Bolivia |
1,167,304.98 | 103.235 | 208,897 | 5.588 |
 Tajikistan Tajikistan |
1,144,900 | 128.194 | 56,600 | 20.228 |
 Azerbaijan Azerbaijan |
1,010,517.4 | 102.092 | 49,449 | 20.436 |
 Tanzania Tanzania |
962,026.17 | 17.75 | 112,131 | 8.579 |
 Afghanistan Afghanistan |
889,000 | 28.155 | 61,000 | 14.574 |
 Rwanda Rwanda |
865,014 | 72.078 | 114,339 | 7.565 |
 Chile Chile |
843,118.74 | 47.975 | 28,986 | 29.087 |
 Sweden Sweden |
810,000 | 79.634 | 22,500 | 36 |
 Turkmenistan Turkmenistan |
788,265.04 | 134.712 | 56,032 | 14.068 |
 Guatemala Guatemala |
666,064.43 | 38.496 | 26,704 | 24.942 |
 Lebanon Lebanon |
659,587.67 | 108.244 | 23,364 | 28.231 |
 Syria Syria |
619,568 | 33.885 | 24,779 | 25.004 |
 Saudi Arabia Saudi Arabia |
610,389.9 | 18.268 | 21,287 | 28.674 |
 Serbia Serbia |
599,574 | 85.636 | 23,145 | 25.905 |
 Austria Austria |
594,040 | 67.213 | 20,620 | 28.809 |
 Zimbabwe Zimbabwe |
580,574 | 39.099 | 22,217 | 26.132 |
 Czech Republic Czech Republic |
573,770 | 54.061 | 20,950 | 27.388 |
 Guinea Guinea |
559,961.24 | 47.121 | 41,154 | 13.606 |
 South Korea South Korea |
544,041.57 | 10.536 | 22,242 | 24.46 |
 Sudan Sudan |
527,770.45 | 12.936 | 42,899 | 12.303 |
 Mozambique Mozambique |
526,249 | 18.233 | 27,173 | 19.367 |
 North Korea North Korea |
522,495.55 | 20.401 | 158,137 | 3.304 |
 Israel Israel |
504,557 | 56.641 | 14,486 | 34.831 |
 Angola Angola |
501,623 | 17.149 | 71,056 | 7.06 |
 Finland Finland |
498,100 | 90.27 | 16,500 | 30.188 |
 Venezuela Venezuela |
475,912.03 | 14.953 | 23,838 | 19.964 |
 Burundi Burundi |
449,576.31 | 42.09 | 41,043 | 10.954 |
 Tunisia Tunisia |
436,138.2 | 38.103 | 24,532 | 17.778 |
 Myanmar Myanmar |
432,362.93 | 8.027 | 28,072 | 15.402 |
 New Zealand New Zealand |
428,570.64 | 87.443 | 8,424 | 50.875 |
 Uganda Uganda |
422,025.79 | 10.87 | 54,320 | 7.769 |
 Libya Libya |
370,357.56 | 57.234 | 18,661 | 19.847 |
 Bosnia and Herzegovina Bosnia and Herzegovina |
366,354 | 96.806 | 25,179 | 14.55 |
 Armenia Armenia |
364,532.1 | 122.746 | 18,695 | 19.499 |
 Cameroon Cameroon |
364,284.39 | 15.31 | 34,407 | 10.588 |
 Switzerland Switzerland |
360,394 | 42.434 | 10,704 | 33.669 |
 Vietnam Vietnam |
340,864.23 | 3.601 | 20,232 | 16.848 |
 Portugal Portugal |
325,080 | 31.589 | 14,480 | 22.45 |
 Ireland Ireland |
322,200 | 66.337 | 8,210 | 39.245 |
 Norway Norway |
313,500 | 59.014 | 11,505 | 27.249 |
 Greece Greece |
309,140 | 28.709 | 10,960 | 28.206 |
 Yemen Yemen |
301,746.48 | 10.436 | 17,534 | 17.209 |
 Niger Niger |
293,472.8 | 13.671 | 8,243 | 35.603 |
 Albania Albania |
274,188.2 | 95.525 | 10,068 | 27.234 |
 Lithuania Lithuania |
267,330 | 95.45 | 14,730 | 18.149 |
 Ecuador Ecuador |
262,037.99 | 15.354 | 17,997 | 14.56 |
 Madagascar Madagascar |
251,036.76 | 9.559 | 41,649 | 6.027 |
 Iraq Iraq |
229,069 | 5.823 | 8,965 | 25.551 |
 Mali Mali |
227,614 | 11.912 | 9,985 | 22.796 |
 Hungary Hungary |
209,950 | 21.487 | 7,570 | 27.734 |
 Georgia Georgia |
197,300 | 52.901 | 16,000 | 12.331 |
 Jordan Jordan |
193,729 | 18.935 | 4,815 | 40.234 |
 Macedonia Macedonia |
184,181 | 88.749 | 12,255 | 15.029 |
 Mongolia Mongolia |
179,367.87 | 55.634 | 19,425 | 9.234 |
 Moldova Moldova |
172,410 | 48.554 | 22,886 | 7.533 |
 Latvia Latvia |
147,500 | 76.596 | 8,000 | 18.438 |
 Senegal Senegal |
140,873.34 | 8.958 | 5,880 | 23.958 |
 Slovakia Slovakia |
135,790 | 24.947 | 5,430 | 25.007 |
 Lesotho Lesotho |
132,481.81 | 58.542 | 7,334 | 18.064 |
 Croatia Croatia |
126,280 | 30.123 | 7,230 | 17.466 |
 Thailand Thailand |
120,474 | 1.741 | 6,511 | 18.503 |
 Bulgaria Bulgaria |
119,240 | 16.913 | 7,020 | 16.986 |
 Congo-Kinshasa Congo-Kinshasa |
106,742 | 1.312 | 23,308 | 4.58 |
 Dominican Republic Dominican Republic |
104,620.72 | 10.191 | 3,645 | 28.703 |
 Cuba Cuba |
101,721.42 | 9.065 | 6,104 | 16.665 |
 Philippines Philippines |
100,054.6 | 0.94 | 6,222 | 16.081 |
 Cyprus Cyprus |
90,000 | 105.288 | 3,800 | 23.684 |
 Costa Rica Costa Rica |
81,272 | 16.243 | 3,104 | 26.183 |
 Estonia Estonia |
79,300 | 60.115 | 3,200 | 24.781 |
 Slovenia Slovenia |
68,580 | 33.18 | 2,940 | 23.327 |
 Uruguay Uruguay |
68,000 | 19.395 | 3,002 | 22.652 |
 Palestinian Territories Palestinian Territories |
65,345.92 | 14.362 | 1,803 | 36.243 |
 Zambia Zambia |
65,082.42 | 3.854 | 2,650 | 24.559 |
 Taiwan Taiwan |
62,175 | 2.637 | 2,738 | 22.708 |
 Nicaragua Nicaragua |
61,819.06 | 9.836 | 3,433 | 18.007 |
 Sri Lanka Sri Lanka |
40,749 | 1.9 | 2,813 | 14.486 |
 Bhutan Bhutan |
37,749 | 51.914 | 3,244 | 11.637 |
 Chad Chad |
36,931.79 | 2.405 | 3,620 | 10.202 |
 Haiti Haiti |
34,959.61 | 3.146 | 2,754 | 12.694 |
 Burkina Faso Burkina Faso |
29,621.54 | 1.463 | 15,284 | 1.938 |
 Honduras Honduras |
27,161.73 | 3.014 | 1,807 | 15.031 |
 Panama Panama |
27,035.37 | 6.501 | 1,032 | 26.197 |
 Montenegro Montenegro |
23,010.86 | 36.974 | 1,404 | 16.39 |
 Kuwait Kuwait |
18,105 | 4.283 | 481 | 37.64 |
 Namibia Namibia |
14,317.51 | 5.932 | 1,186 | 12.072 |
 Mauritius Mauritius |
13,719 | 10.846 | 749 | 18.316 |
 Jamaica Jamaica |
13,301 | 4.874 | 973 | 13.67 |
 Luxembourg Luxembourg |
12,840 | 21.329 | 560 | 22.929 |
 Oman Oman |
12,462 | 2.487 | 488 | 25.537 |
 Swaziland Swaziland |
8,666.7 | 7.476 | 4,109 | 2.109 |
 El Salvador El Salvador |
7,333.37 | 1.104 | 229 | 32.023 |
 Iceland Iceland |
7,298 | 20.67 | 470 | 15.528 |
 Congo-Brazzaville Congo-Brazzaville |
7,112.22 | 1.317 | 825 | 8.621 |
 Malta Malta |
5,500 | 11.562 | 420 | 13.095 |
 Paraguay Paraguay |
3,958.58 | 0.561 | 265 | 14.938 |
 Botswana Botswana |
3,696.62 | 1.605 | 951 | 3.887 |
 Comoros Comoros |
3,554.88 | 4.179 | 235 | 15.127 |
 Laos Laos |
3,526.95 | 0.507 | 111 | 31.774 |
 Cape Verde Cape Verde |
2,534 | 4.657 | 175 | 14.48 |
 Mauritania Mauritania |
2,467.16 | 0.619 | 387 | 6.375 |
 Faroe Islands Faroe Islands |
1,528.52 | 29.915 | 99 | 15.44 |
 Belize Belize |
1,481 | 3.741 | 116 | 12.767 |
 Central African Republic Central African Republic |
1,378.29 | 0.291 | 1,293 | 1.066 |
 United Arab Emirates United Arab Emirates |
1,288.16 | 0.135 | 49 | 26.289 |
 Papua New Guinea Papua New Guinea |
1,262.97 | 0.148 | 213 | 5.929 |
 East Timor East Timor |
1,243.15 | 0.986 | 1,363 | 0.912 |
 Qatar Qatar |
1,024.4 | 0.418 | 34 | 30.129 |
 Benin Benin |
253.42 | 0.022 | 37 | 6.849 |
 Dominica Dominica |
149.74 | 2.1 | 10 | 14.974 |
 Bahrain Bahrain |
120 | 0.08 | 8 | 15 |
 Eritrea Eritrea |
59.58 | 0.011 | 90 | 0.662 |
 Vanuatu Vanuatu |
3 | 0.01 | 1 | 3 |
Top Potato Producing Countries by Share
- China leads with nearly 25% of the global potato production, showing its pivotal role in the worldwide supply chain.
- India contributes about 16%, marking its place as a significant player in the potato industry.
- Ukraine and the United States of America contribute around 6% and 5%, respectively, highlighting their importance in global potato production.
- Canada accounts for about 1.7% of global production, showcasing its presence in the industry despite a lower share compared to leading countries.