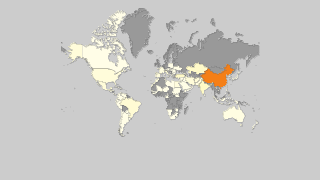
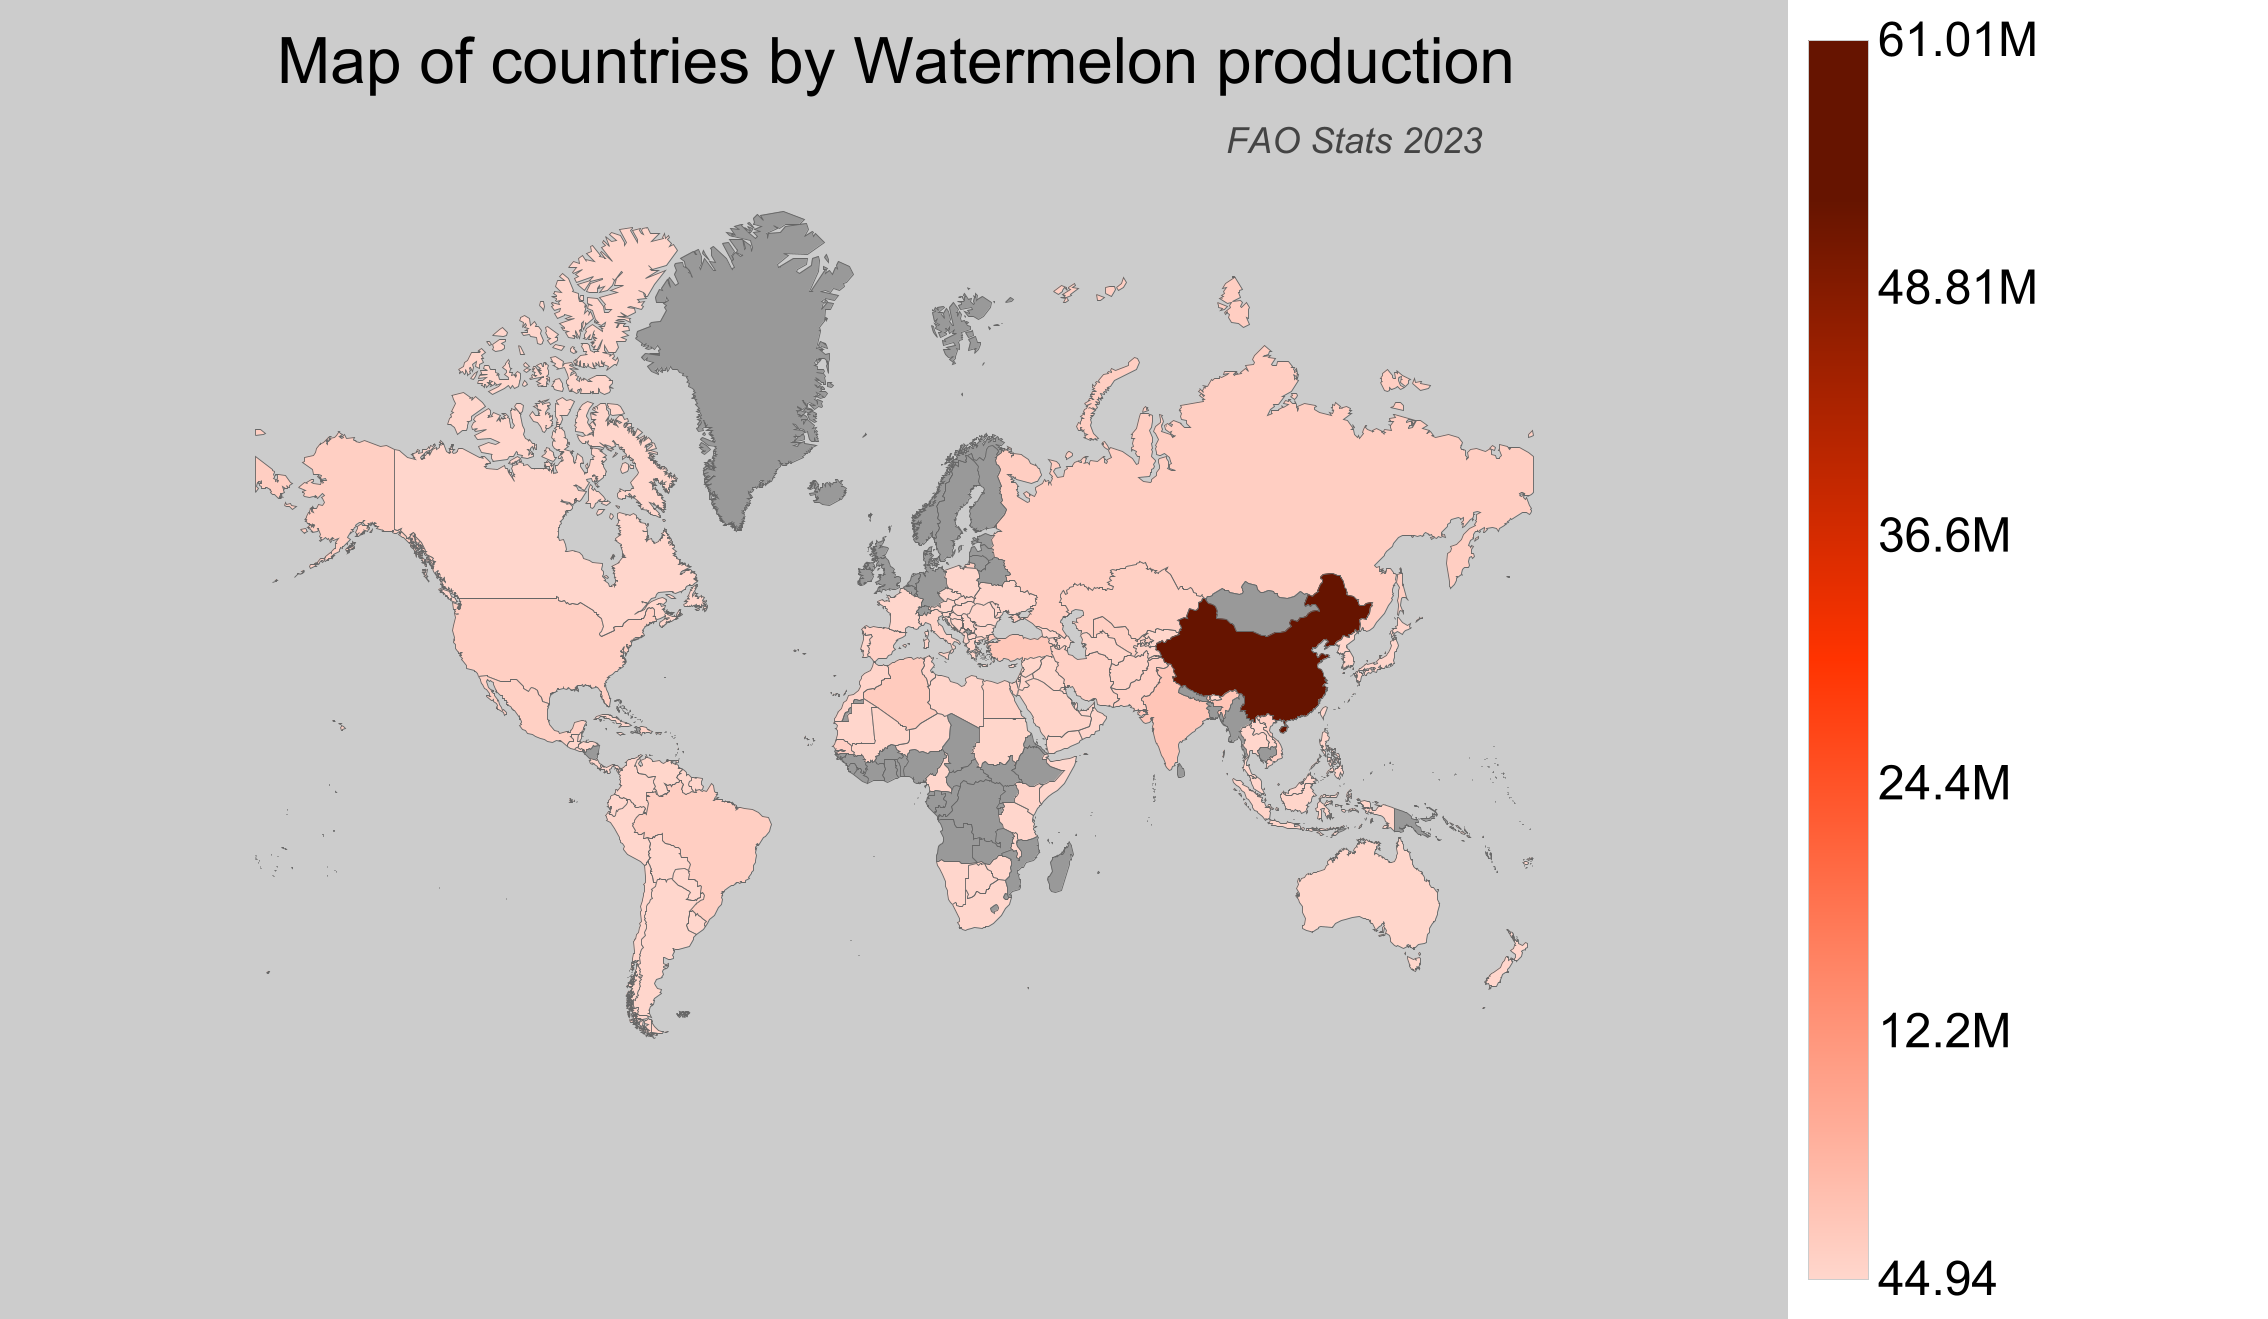
Countries by Watermelon production
Watermelons are not only a refreshing delight during the hot summer months but also a significant agricultural product worldwide. Known for thriving in warm climates with plenty of sunshine, watermelons are cultivated in diverse regions across the globe. Their importance stems from their nutritional value and economic impact. This page provides an overview of the latest available data as of 2025 on global watermelon production for the year 2023, as reported by the Food and Agriculture Organization (FAO).
Global Watermelon Production
In 2023, global watermelon production reached around 105 million tonnes, marking a significant increase from approximately 18 million tonnes in 1961. This upward trend reflects the growing demand and improved agricultural practices over the decades. Since 1961, production has risen by over 86 million tonnes, showcasing substantial growth. Particularly of note is the consistent production increments seen throughout the 21st century.
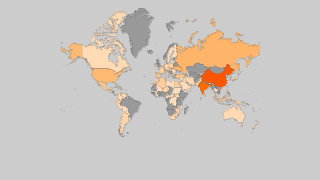
Watermelon Production by Country
- China leads the world in watermelon production, achieving around 61 million tonnes in 2023.
- India comes in second place with a production of about 3.6 million tonnes.
- Turkey follows closely with just over 3.1 million tonnes of production.
- Algeria also makes a significant contribution with approximately 2.5 million tonnes.
- Canada, while ranked 74th globally, had a watermelon production volume of around 36,283 tonnes, underscoring its growing but modest position in the market.
| Country | Production (tonnes) | Production per Person (kg) | Harvested Area (ha) | Yield (kg/ha) |
|---|---|---|---|---|
 China China |
61,013,536.64 | 43.773 | 1,415,941 | 43.09 |
 India India |
3,626,000 | 2.713 | 126,000 | 28.778 |
 Turkey Turkey |
3,147,921 | 36.873 | 64,070 | 49.133 |
 Algeria Algeria |
2,507,140.41 | 58.928 | 63,258 | 39.634 |
 Brazil Brazil |
1,781,971 | 8.504 | 80,833 | 22.045 |
 Russian Federation Russian Federation |
1,770,123.47 | 12.052 | 97,334 | 18.186 |
 United States of America United States of America |
1,682,669 | 5.134 | 40,955 | 41.086 |
 Uzbekistan Uzbekistan |
1,572,144.48 | 48.146 | 38,007 | 41.365 |
 Pakistan Pakistan |
1,507,338.61 | 7.467 | 40,642 | 37.088 |
 Senegal Senegal |
1,492,961.77 | 94.936 | 90,938 | 16.417 |
 Kazakhstan Kazakhstan |
1,435,333.02 | 78.552 | 53,252 | 26.954 |
 Mexico Mexico |
1,428,910.28 | 11.455 | 42,717 | 33.451 |
 Iran Iran |
1,366,802 | 16.718 | 58,446 | 23.386 |
 Vietnam Vietnam |
1,278,570.73 | 13.507 | 50,964 | 25.088 |
 Spain Spain |
1,168,930 | 25.052 | 21,460 | 54.47 |
 Egypt Egypt |
1,000,421.31 | 10.261 | 30,217 | 33.108 |
 Afghanistan Afghanistan |
943,668.36 | 29.887 | 61,591 | 15.322 |
 Tajikistan Tajikistan |
838,255.34 | 93.859 | 24,686 | 33.957 |
 Dominican Republic Dominican Republic |
828,479.54 | 80.7 | 2,453 | 337.741 |
 Italy Italy |
751,570 | 12.436 | 15,170 | 49.543 |
 Turkmenistan Turkmenistan |
613,569.41 | 104.857 | 28,571 | 21.475 |
 Saudi Arabia Saudi Arabia |
612,679.87 | 18.336 | 25,198 | 24.315 |
 Kenya Kenya |
489,700 | 9.611 | 11,413 | 42.907 |
 Morocco Morocco |
462,719.8 | 13.306 | 14,582 | 31.732 |
 Tunisia Tunisia |
460,751.66 | 40.253 | 4,432 | 103.96 |
 South Korea South Korea |
459,554.42 | 8.9 | 11,092 | 41.431 |
 Mali Mali |
416,173 | 21.78 | 28,609 | 14.547 |
 Indonesia Indonesia |
408,115.33 | 1.54 | 31,458 | 12.973 |
 Greece Greece |
396,460 | 36.818 | 6,430 | 61.658 |
 Azerbaijan Azerbaijan |
351,022.9 | 35.464 | 12,549 | 27.972 |
 Japan Japan |
303,087.71 | 2.396 | 8,979 | 33.755 |
 Albania Albania |
281,354 | 98.022 | 5,848 | 48.111 |
 Libya Libya |
232,447.64 | 35.922 | 19,493 | 11.925 |
 Colombia Colombia |
218,229.85 | 4.371 | 12,923 | 16.887 |
 Ukraine Ukraine |
215,720 | 5.104 | 23,400 | 9.219 |
 Kyrgyzstan Kyrgyzstan |
198,917 | 31.528 | 8,482 | 23.452 |
 Syria Syria |
196,743 | 10.76 | 30,243 | 6.505 |
 Iraq Iraq |
192,862 | 4.902 | 8,775 | 21.979 |
 Venezuela Venezuela |
179,450.78 | 5.638 | 8,194 | 21.9 |
 Yemen Yemen |
174,211.21 | 6.025 | 10,584 | 16.46 |
 Sudan Sudan |
173,572.29 | 4.255 | 37,653 | 4.61 |
 Australia Australia |
171,946.18 | 6.864 | 3,937 | 43.674 |
 Thailand Thailand |
166,561.49 | 2.408 | 6,909 | 24.108 |
 Niger Niger |
163,398.01 | 7.612 | 5,059 | 32.298 |
 Serbia Serbia |
160,959.08 | 22.989 | 5,229 | 30.782 |
 Peru Peru |
160,065 | 5.124 | 4,933 | 32.448 |
 Laos Laos |
157,208.62 | 22.584 | 8,053 | 19.522 |
 Taiwan Taiwan |
151,190 | 6.413 | 7,644 | 19.779 |
 Zimbabwe Zimbabwe |
150,600 | 10.142 | 4,610 | 32.668 |
 Romania Romania |
148,200 | 7.591 | 7,600 | 19.5 |
 Guatemala Guatemala |
133,710.71 | 7.728 | 3,148 | 42.475 |
 Argentina Argentina |
125,674.16 | 2.824 | 9,024 | 13.927 |
 Philippines Philippines |
124,737.55 | 1.172 | 8,335 | 14.966 |
 Hungary Hungary |
124,700 | 12.762 | 2,880 | 43.299 |
 Macedonia Macedonia |
124,314 | 59.902 | 4,886 | 25.443 |
 Malaysia Malaysia |
121,824.4 | 3.731 | 8,982 | 13.563 |
 Paraguay Paraguay |
118,923.78 | 16.861 | 24,258 | 4.902 |
 Armenia Armenia |
116,653.2 | 39.28 | 3,985 | 29.273 |
 Israel Israel |
108,049 | 12.13 | 4,683 | 23.073 |
 Tanzania Tanzania |
102,737.69 | 1.896 | 13,757 | 7.468 |
 Cameroon Cameroon |
94,224.19 | 3.96 | 4,525 | 20.823 |
 North Korea North Korea |
91,626.79 | 3.578 | 6,167 | 14.858 |
 Jordan Jordan |
90,055 | 8.802 | 1,520 | 59.247 |
 Bulgaria Bulgaria |
80,130 | 11.366 | 3,710 | 21.598 |
 Ecuador Ecuador |
77,035.85 | 4.514 | 5,039 | 15.288 |
 Honduras Honduras |
68,173.14 | 7.565 | 1,220 | 55.88 |
 South Africa South Africa |
63,690 | 1.103 | 3,884 | 16.398 |
 Costa Rica Costa Rica |
63,240 | 12.639 | 2,817 | 22.449 |
 Bolivia Bolivia |
60,973.19 | 5.392 | 4,406 | 13.839 |
 Lebanon Lebanon |
57,199.69 | 9.387 | 1,132 | 50.53 |
 El Salvador El Salvador |
48,922.57 | 7.364 | 2,230 | 21.938 |
 Chile Chile |
48,064.42 | 2.735 | 2,939 | 16.354 |
 Oman Oman |
44,585 | 8.897 | 1,268 | 35.162 |
 Canada Canada |
36,283 | 0.975 | 836 | 43.401 |
 Georgia Georgia |
34,800 | 9.331 | 1,100 | 31.636 |
 Cuba Cuba |
34,318.57 | 3.058 | 2,189 | 15.678 |
 Moldova Moldova |
30,829 | 8.682 | 5,291 | 5.827 |
 Guyana Guyana |
30,356.8 | 38.808 | 264 | 114.988 |
 Portugal Portugal |
27,670 | 2.689 | 760 | 36.408 |
 Croatia Croatia |
26,440 | 6.307 | 920 | 28.739 |
 France France |
23,510 | 0.349 | 930 | 25.28 |
 Bosnia and Herzegovina Bosnia and Herzegovina |
19,935 | 5.268 | 594 | 33.561 |
 Jamaica Jamaica |
18,873 | 6.916 | 860 | 21.945 |
 Montenegro Montenegro |
17,298.31 | 27.795 | 415 | 41.683 |
 Panama Panama |
15,974.24 | 3.841 | 648 | 24.652 |
 Botswana Botswana |
15,790.67 | 6.857 | 129 | 122.408 |
 Palestinian Territories Palestinian Territories |
15,443.07 | 3.394 | 282 | 54.763 |
 Cyprus Cyprus |
13,060 | 15.278 | 350 | 37.314 |
 Uruguay Uruguay |
11,185.73 | 3.19 | 626 | 17.869 |
 Fiji Fiji |
8,160.6 | 9.222 | 680 | 12.001 |
 Somalia Somalia |
6,398.48 | 0.421 | 664 | 9.636 |
 Poland Poland |
6,300 | 0.164 | 200 | 31.5 |
 Namibia Namibia |
3,571.23 | 1.48 | 322 | 11.091 |
 Malta Malta |
3,560 | 7.484 | 94 | 37.872 |
 Slovakia Slovakia |
3,340 | 0.614 | 80 | 41.75 |
 Malawi Malawi |
3,058.18 | 0.171 | 87 | 35.151 |
 United Arab Emirates United Arab Emirates |
2,580.18 | 0.27 | 89 | 28.991 |
 Belize Belize |
2,545 | 6.429 | 102 | 24.951 |
 Mauritania Mauritania |
2,519.23 | 0.632 | 4,772 | 0.528 |
 Czech Republic Czech Republic |
2,490 | 0.235 | 60 | 41.5 |
 New Zealand New Zealand |
2,409.39 | 0.492 | 231 | 10.43 |
 Austria Austria |
2,260 | 0.256 | 60 | 37.667 |
 Suriname Suriname |
1,459.92 | 2.569 | 75 | 19.466 |
 Kuwait Kuwait |
1,134 | 0.268 | 30 | 37.8 |
 Qatar Qatar |
1,090 | 0.445 | 55 | 19.818 |
 Solomon Islands Solomon Islands |
1,058.52 | 1.587 | 75 | 14.114 |
 Grenada Grenada |
1,001 | 9.688 | 83 | 12.06 |
 Cape Verde Cape Verde |
890.07 | 1.636 | 41 | 21.709 |
 Bahrain Bahrain |
820 | 0.548 | 24 | 34.167 |
 Trinidad and Tobago Trinidad and Tobago |
681 | 0.502 | 174 | 3.914 |
 Slovenia Slovenia |
680 | 0.329 | 20 | 34 |
 Saint Lucia Saint Lucia |
510 | 2.852 | 14 | 36.429 |
 Tonga Tonga |
444.94 | 4.421 | 60 | 7.416 |
 Brunei Brunei |
300.88 | 0.712 | 20 | 15.044 |
 Dominica Dominica |
280.87 | 3.94 | 22 | 12.767 |
 Antigua and Barbuda Antigua and Barbuda |
139.81 | 1.62 | 28 | 4.993 |
 Saint Kitts and Nevis Saint Kitts and Nevis |
129 | 2.792 | 8 | 16.125 |
 Djibouti Djibouti |
70.55 | 0.067 | 3 | 23.517 |
 Cook Islands Cook Islands |
65.42 | 3.517 | 3 | 21.807 |
 Bhutan Bhutan |
44.94 | 0.062 | 8 | 5.617 |
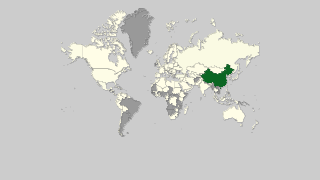
Top Watermelon Producing Countries by Share
- China dominates global watermelon production with a staggering 58.15% of the total output in 2023, highlighting its crucial role in the industry.
- India is responsible for about 3.46% of the global share, solidifying its place as an essential producer.
- Turkey accounts for approximately 3.00% of the global watermelon production.
- Algeria contributes around 2.39%, making it a notable player in the watermelon market.
- While Canada accounts for only 0.03% of the global production, it is an important producer within North America.