Countries by Pumpkin production
Pumpkins are a versatile and nutritious crop, essential in global agriculture due to their use in food, decoration, and cultural traditions. They thrive in temperate climates with a balance of warm days and cool nights, making them suitable for regions with such conditions. According to the latest available data for the year 2023 from the Food and Agriculture Organization (FAO) stats database, pumpkins continue to play a significant role in agricultural production worldwide.
Global Pumpkin Production
In 2023, global pumpkin production reached approximately 23.7 million tonnes. Over the decades, production has witnessed an upward trend since 1961, with a significant increase from an initial production of around 6.7 million tonnes. Notably, the expansion is marked by sustained growth and pivotal milestones, highlighting the increasing demand and cultivation improvements over the years.
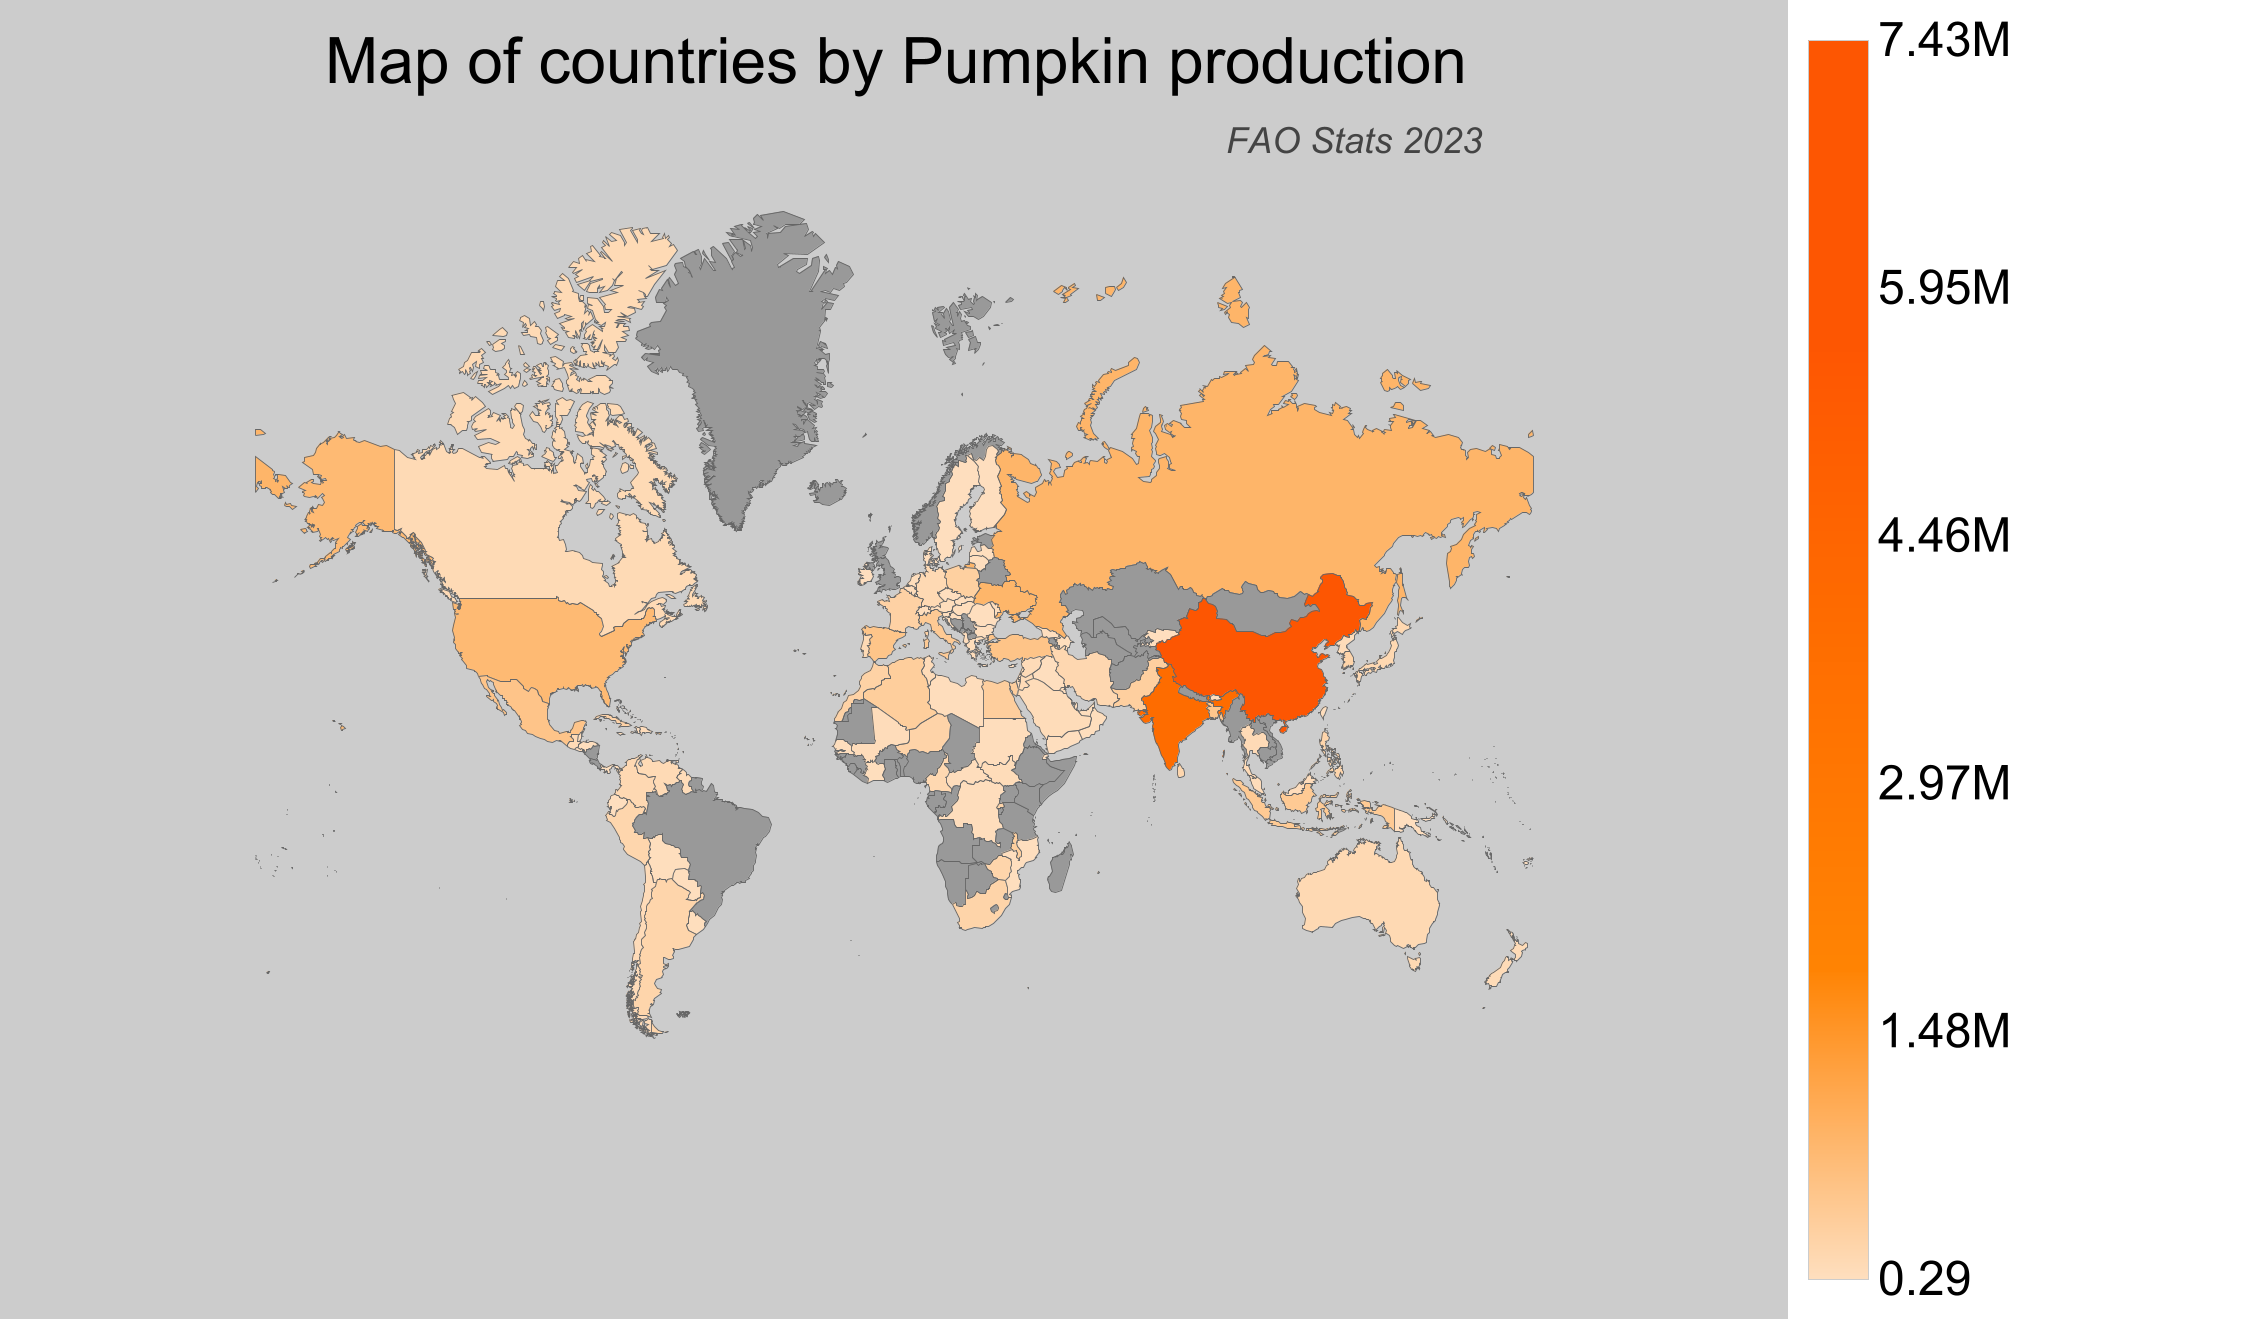
Pumpkin Production by Country
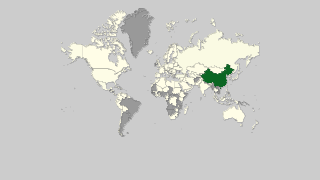
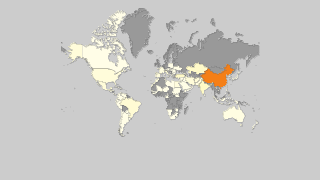
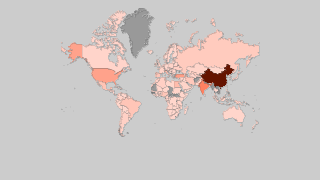
- China stands as the leading pumpkin producer in 2023, with a production volume of approximately 7.4 million tonnes, showcasing its dominance in global production.
- India follows as the second-largest producer, harvesting over 5.2 million tonnes of pumpkins, reflecting its significant agricultural capacity.
- The Russian Federation produced around 1.13 million tonnes, marking it as a key player in pumpkin cultivation.
- Ukraine contributes significantly with a production of about 1.1 million tonnes.
- Although Canada ranks 36th in global production, it contributed around 132,491 tonnes to the world's pumpkin output in 2023.
| Country | Production (tonnes) | Production per Person (kg) | Harvested Area (ha) | Yield (kg/ha) |
|---|---|---|---|---|
 China China |
7,439,924.26 | 5.338 | 401,581 | 18.527 |
 India India |
5,203,113.51 | 3.893 | 541,941 | 9.601 |
 Russian Federation Russian Federation |
1,130,054.18 | 7.694 | 51,552 | 21.921 |
 Ukraine Ukraine |
1,114,030 | 26.359 | 51,900 | 21.465 |
 United States of America United States of America |
998,008 | 3.045 | 42,250 | 23.621 |
 Turkey Turkey |
726,594 | 8.511 | 85,964 | 8.452 |
 Mexico Mexico |
715,772.75 | 5.738 | 33,943 | 21.087 |
 Spain Spain |
706,880 | 15.15 | 16,620 | 42.532 |
 Bangladesh Bangladesh |
667,629 | 4.043 | 50,623 | 13.188 |
 Italy Italy |
560,630 | 9.276 | 18,930 | 29.616 |
 Indonesia Indonesia |
557,438.91 | 2.103 | 8,316 | 67.032 |
 Algeria Algeria |
455,140.94 | 10.698 | 15,663 | 29.058 |
 Egypt Egypt |
445,361.4 | 4.568 | 21,749 | 20.477 |
 Malawi Malawi |
430,035.22 | 23.982 | 19,558 | 21.988 |
 Pakistan Pakistan |
420,569 | 2.083 | 26,648 | 15.782 |
 Poland Poland |
403,600 | 10.501 | 9,000 | 44.844 |
 France France |
356,830 | 5.302 | 12,520 | 28.501 |
 Morocco Morocco |
331,637.5 | 9.537 | 14,534 | 22.818 |
 Cuba Cuba |
327,569.38 | 29.192 | 31,799 | 10.301 |
 Niger Niger |
302,093.08 | 14.073 | 8,326 | 36.283 |
 South Africa South Africa |
282,926 | 4.901 | 37,191 | 7.607 |
 South Korea South Korea |
282,651.85 | 5.474 | 8,503 | 33.241 |
 Rwanda Rwanda |
269,395.7 | 22.448 | 51,792 | 5.201 |
 Philippines Philippines |
260,984.65 | 2.453 | 19,252 | 13.556 |
 Zimbabwe Zimbabwe |
260,700 | 17.557 | 14,670 | 17.771 |
 Argentina Argentina |
257,597.81 | 5.789 | 17,281 | 14.906 |
 Sri Lanka Sri Lanka |
228,305 | 10.647 | 19,420 | 11.756 |
 Peru Peru |
226,185.65 | 7.241 | 9,022 | 25.07 |
 Iran Iran |
193,536.03 | 2.367 | 28,470 | 6.798 |
 Cameroon Cameroon |
177,793.55 | 7.472 | 151,987 | 1.17 |
 Japan Japan |
175,420.45 | 1.387 | 14,656 | 11.969 |
 Colombia Colombia |
167,022.95 | 3.345 | 15,940 | 10.478 |
 Australia Australia |
155,417 | 6.204 | 7,339 | 21.177 |
 Germany Germany |
149,680 | 1.809 | 6,510 | 22.992 |
 Portugal Portugal |
134,640 | 13.083 | 4,280 | 31.458 |
 Canada Canada |
132,491 | 3.56 | 7,397 | 17.911 |
 Venezuela Venezuela |
128,824.5 | 4.048 | 8,080 | 15.944 |
 Thailand Thailand |
112,190.02 | 1.622 | 5,447 | 20.597 |
 Guatemala Guatemala |
111,597.95 | 6.45 | 7,171 | 15.562 |
 New Zealand New Zealand |
92,907.86 | 18.956 | 4,800 | 19.356 |
 Tunisia Tunisia |
87,541.5 | 7.648 | 3,155 | 27.747 |
 Jordan Jordan |
86,303 | 8.435 | 3,168 | 27.242 |
 Syria Syria |
84,463 | 4.619 | 6,044 | 13.975 |
 Chile Chile |
83,372.02 | 4.744 | 4,271 | 19.52 |
 Saudi Arabia Saudi Arabia |
74,172.63 | 2.22 | 2,683 | 27.645 |
 Guyana Guyana |
72,100.47 | 92.174 | 327 | 220.491 |
 North Korea North Korea |
71,694.71 | 2.799 | 7,795 | 9.198 |
 South Sudan South Sudan |
68,450.41 | 5.554 | 4,341 | 15.768 |
 Mali Mali |
65,949 | 3.451 | 4,040 | 16.324 |
 Dominican Republic Dominican Republic |
65,121.66 | 6.343 | 9,772 | 6.664 |
 Jamaica Jamaica |
60,877 | 22.309 | 3,363 | 18.102 |
 Belgium Belgium |
57,880 | 5.07 | 1,480 | 39.108 |
 Malaysia Malaysia |
56,731.8 | 1.737 | 3,989 | 14.222 |
 Taiwan Taiwan |
52,070 | 2.209 | 2,572 | 20.245 |
 Palestinian Territories Palestinian Territories |
51,031.42 | 11.216 | 2,100 | 24.301 |
 Greece Greece |
48,260 | 4.482 | 1,750 | 27.577 |
 The Netherlands The Netherlands |
39,950 | 2.316 | 1,670 | 23.922 |
 Hungary Hungary |
36,390 | 3.724 | 2,160 | 16.847 |
 Libya Libya |
35,529.9 | 5.491 | 1,635 | 21.731 |
 Sudan Sudan |
34,020.32 | 0.834 | 2,127 | 15.995 |
 Mauritius Mauritius |
32,906 | 26.015 | 2,155 | 15.27 |
 Central African Republic Central African Republic |
31,943 | 6.743 | 79,857 | 0.4 |
 Moldova Moldova |
30,794 | 8.672 | 3,615 | 8.518 |
 Congo-Kinshasa Congo-Kinshasa |
30,398.73 | 0.374 | 2,831 | 10.738 |
 Lebanon Lebanon |
28,194.12 | 4.627 | 1,402 | 20.11 |
 Austria Austria |
27,900 | 3.157 | 940 | 29.681 |
 Albania Albania |
27,493.3 | 9.578 | 798 | 34.453 |
 Uruguay Uruguay |
26,441.87 | 7.542 | 2,224 | 11.889 |
 Bolivia Bolivia |
24,599.92 | 2.176 | 3,187 | 7.719 |
 Azerbaijan Azerbaijan |
24,171.7 | 2.442 | 935 | 25.852 |
 Panama Panama |
22,837.06 | 5.491 | 2,074 | 11.011 |
 Tonga Tonga |
20,654 | 205.204 | 2,292 | 9.011 |
 United Arab Emirates United Arab Emirates |
20,155.01 | 2.112 | 755 | 26.695 |
 Côte d'Ivoire Côte d'Ivoire |
19,302.66 | 0.775 | 1,973 | 9.783 |
 Honduras Honduras |
17,702.47 | 1.964 | 1,106 | 16.006 |
 Senegal Senegal |
17,258.82 | 1.097 | 742 | 23.26 |
 Qatar Qatar |
15,494 | 6.323 | 634 | 24.438 |
 Oman Oman |
15,446 | 3.082 | 649 | 23.8 |
 Switzerland Switzerland |
14,002 | 1.649 | 793 | 17.657 |
 Czech Republic Czech Republic |
13,210 | 1.245 | 600 | 22.017 |
 Bulgaria Bulgaria |
12,390 | 1.757 | 860 | 14.407 |
 Yemen Yemen |
11,559 | 0.4 | 1,577 | 7.33 |
 Lithuania Lithuania |
11,480 | 4.099 | 1,550 | 7.406 |
 Romania Romania |
11,440 | 0.586 | 920 | 12.435 |
 Iraq Iraq |
11,095 | 0.282 | 1,035 | 10.72 |
 Kuwait Kuwait |
10,346 | 2.448 | 353 | 29.309 |
 Paraguay Paraguay |
8,855.22 | 1.256 | 2,128 | 4.161 |
 El Salvador El Salvador |
8,544.98 | 1.286 | 1,358 | 6.292 |
 Croatia Croatia |
8,460 | 2.018 | 450 | 18.8 |
 Sweden Sweden |
7,010 | 0.689 | 360 | 19.472 |
 Israel Israel |
6,354 | 0.713 | 229 | 27.747 |
 Slovenia Slovenia |
5,140 | 2.487 | 220 | 23.364 |
 Georgia Georgia |
5,000 | 1.341 | 189 | 26.455 |
 Bhutan Bhutan |
4,930.89 | 6.781 | 551 | 8.949 |
 Latvia Latvia |
4,330 | 2.249 | 530 | 8.17 |
 Ecuador Ecuador |
4,310.55 | 0.253 | 1,155 | 3.732 |
 Kyrgyzstan Kyrgyzstan |
3,573.49 | 0.566 | 300 | 11.912 |
 Finland Finland |
3,040 | 0.551 | 130 | 23.385 |
 Cyprus Cyprus |
2,700 | 3.159 | 130 | 20.769 |
 The Bahamas The Bahamas |
2,123.34 | 5.568 | 111 | 19.129 |
 Luxembourg Luxembourg |
2,020 | 3.355 | 100 | 20.2 |
 Fiji Fiji |
1,978.73 | 2.236 | 297 | 6.662 |
 Slovakia Slovakia |
1,860 | 0.342 | 420 | 4.429 |
 Dominica Dominica |
1,819.87 | 25.527 | 182 | 9.999 |
 Cape Verde Cape Verde |
1,608.75 | 2.957 | 123 | 13.079 |
 Malta Malta |
1,416 | 2.977 | 68 | 20.824 |
 Trinidad and Tobago Trinidad and Tobago |
1,252 | 0.923 | 432 | 2.898 |
 Mozambique Mozambique |
1,085.26 | 0.038 | 632 | 1.717 |
 Bahrain Bahrain |
970 | 0.648 | 11 | 88.182 |
 Ireland Ireland |
880 | 0.181 | 140 | 6.286 |
 Denmark Denmark |
780 | 0.135 | 40 | 19.5 |
 Haiti Haiti |
648.31 | 0.058 | 53 | 12.232 |
 Brunei Brunei |
604.98 | 1.431 | 31 | 19.515 |
 Saint Lucia Saint Lucia |
480 | 2.684 | 40 | 12 |
 Barbados Barbados |
468.39 | 1.636 | 75 | 6.245 |
 Grenada Grenada |
394.11 | 3.814 | 23 | 17.135 |
 Antigua and Barbuda Antigua and Barbuda |
318.13 | 3.687 | 52 | 6.118 |
 Papua New Guinea Papua New Guinea |
150.92 | 0.018 | 86 | 1.755 |
 Saint Vincent and the Grenadines Saint Vincent and the Grenadines |
138 | 1.26 | 13 | 10.615 |
 Belize Belize |
105.8 | 0.267 | 10 | 10.58 |
 Djibouti Djibouti |
17.25 | 0.016 | 1 | 17.25 |
 Nauru Nauru |
0.29 | 0.029 | 0 | ∞ |
Top Pumpkin Producing Countries by Share
- China alone accounts for over 31% of the global pumpkin production, highlighting its substantial contribution.
- India holds nearly 22% of the global share, reinforcing its prominence in the sector.
- With nearly 5% each, the Russian Federation and Ukraine are notable contributors to the global pumpkin supply.
- Despite its smaller scale, Canada's share is noteworthy as it reflects the diverse landscapes where pumpkins can thrive globally.