Countries by Melon production
Melons, valued for their sweet and refreshing taste, are an essential fruit grown in warm climates across various regions worldwide. The production data for melons in 2023 is curated from the latest available statistics from the Food and Agriculture Organization (FAO) database as of 2025. Increasingly popular for their health benefits and versatility, melons are a staple in many diets, thriving particularly in temperate and subtropical areas.
Global Melon Production
In 2023, global melon production reached around 29.5 million tonnes. Since 1961, when 6.99 million tonnes were produced, the world has seen a significant upward trend in melon production. Key milestones include surpassing 10 million tonnes in the early 1980s and consistently exceeding 20 million tonnes since the early 2000s. Over the years, global efforts in agriculture techniques and expansion of cultivated areas have contributed to this immense growth.
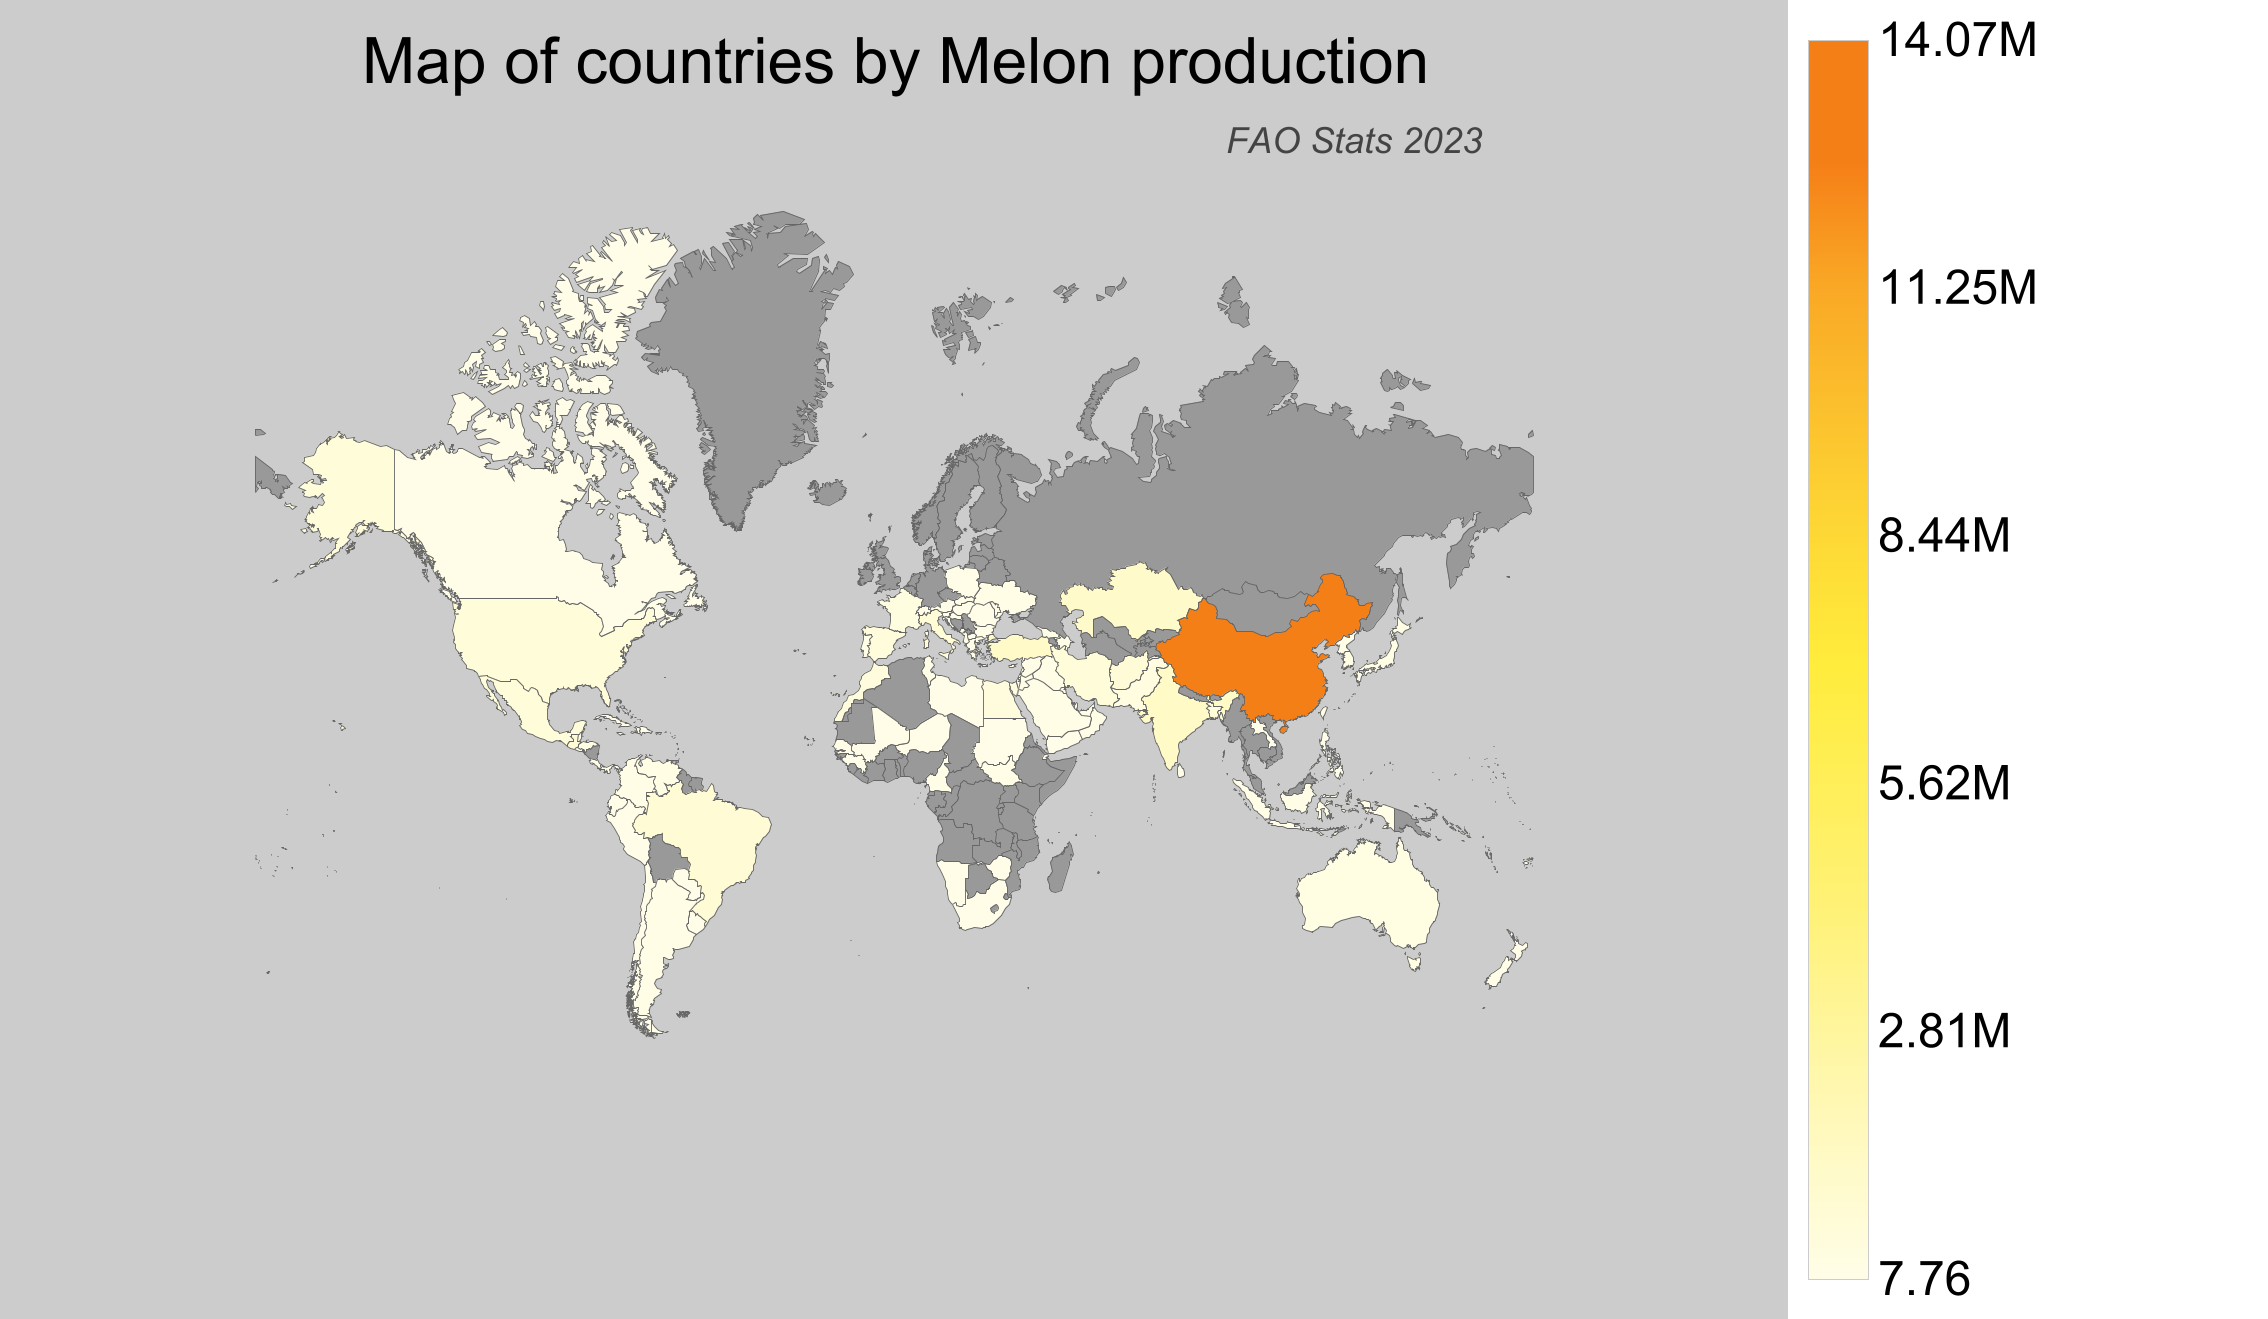
Melon Production by Country
- China leads the world with an astounding production of approximately 14.07 million tonnes, making it the undisputed melon capital.
- India follows as a significant producer with around 1.5 million tonnes, reflecting its extensive agricultural practices.
- Turkey, with its favorable climate for melon cultivation, produced approximately 1.4 million tonnes.
- Kazakhstan contributed around 1.37 million tonnes, showcasing the fruit's adaptability to different environments.
- Canada, despite being ranked at 63, produced 10,351 tonnes of melons demonstrating niche farming success.
| Country | Production (tonnes) | Production per Person (kg) | Harvested Area (ha) | Yield (kg/ha) |
|---|---|---|---|---|
 China China |
14,071,555.28 | 10.095 | 387,089 | 36.352 |
 India India |
1,498,000 | 1.121 | 68,000 | 22.029 |
 Turkey Turkey |
1,403,214 | 16.436 | 54,812 | 25.6 |
 Kazakhstan Kazakhstan |
1,371,382.19 | 75.052 | 54,575 | 25.128 |
 Brazil Brazil |
862,387 | 4.116 | 30,535 | 28.243 |
 Guatemala Guatemala |
850,356.66 | 49.148 | 39,600 | 21.474 |
 Afghanistan Afghanistan |
795,100.45 | 25.181 | 73,628 | 10.799 |
 Italy Italy |
762,580 | 12.618 | 25,490 | 29.917 |
 Mexico Mexico |
648,541 | 5.199 | 19,759 | 32.823 |
 Iran Iran |
631,272.27 | 7.721 | 29,101 | 21.692 |
 United States of America United States of America |
597,585 | 1.823 | 20,963 | 28.507 |
 Bangladesh Bangladesh |
586,608.69 | 3.552 | 31,259 | 18.766 |
 Spain Spain |
516,520 | 11.07 | 16,570 | 31.172 |
 Egypt Egypt |
453,413 | 4.651 | 16,827 | 26.946 |
 Morocco Morocco |
450,041.1 | 12.942 | 11,647 | 38.64 |
 Pakistan Pakistan |
398,986.67 | 1.976 | 23,256 | 17.156 |
 France France |
322,500 | 4.792 | 13,590 | 23.731 |
 Honduras Honduras |
278,977.68 | 30.955 | 5,179 | 53.867 |
 Australia Australia |
226,022 | 9.023 | 6,584 | 34.329 |
 South Korea South Korea |
194,152.64 | 3.76 | 4,569 | 42.493 |
 Venezuela Venezuela |
141,573.32 | 4.448 | 6,434 | 22.004 |
 Japan Japan |
136,312.19 | 1.078 | 5,603 | 24.328 |
 Indonesia Indonesia |
117,793.81 | 0.444 | 7,039 | 16.734 |
 Tunisia Tunisia |
108,598.74 | 9.488 | 10,292 | 10.552 |
 Azerbaijan Azerbaijan |
87,175.3 | 8.807 | 4,690 | 18.587 |
 North Korea North Korea |
82,451.94 | 3.219 | 7,562 | 10.903 |
 Iraq Iraq |
81,873 | 2.081 | 5,035 | 16.261 |
 Argentina Argentina |
81,150.26 | 1.824 | 5,170 | 15.696 |
 Colombia Colombia |
71,606.43 | 1.434 | 4,740 | 15.107 |
 Greece Greece |
65,430 | 6.076 | 2,810 | 23.285 |
 Jordan Jordan |
64,757 | 6.329 | 1,643 | 39.414 |
 Ukraine Ukraine |
58,870 | 1.393 | 10,800 | 5.451 |
 Taiwan Taiwan |
58,261 | 2.471 | 4,527 | 12.87 |
 Costa Rica Costa Rica |
58,202 | 11.633 | 2,561 | 22.726 |
 Syria Syria |
55,478 | 3.034 | 2,510 | 22.103 |
 South Sudan South Sudan |
54,722.9 | 4.441 | 2,432 | 22.501 |
 Portugal Portugal |
52,940 | 5.144 | 1,860 | 28.462 |
 Saudi Arabia Saudi Arabia |
52,903.87 | 1.583 | 2,538 | 20.845 |
 Albania Albania |
52,062.3 | 18.138 | 1,721 | 30.251 |
 Cuba Cuba |
49,050.75 | 4.371 | 6,364 | 7.708 |
 Cameroon Cameroon |
47,284.72 | 1.987 | 5,007 | 9.444 |
 Oman Oman |
46,964 | 9.372 | 1,675 | 28.038 |
 Dominican Republic Dominican Republic |
44,939.44 | 4.377 | 1,517 | 29.624 |
 Sudan Sudan |
40,536.57 | 0.994 | 1,718 | 23.595 |
 Chile Chile |
38,366.78 | 2.183 | 2,895 | 13.253 |
 Mali Mali |
37,499 | 1.963 | 2,547 | 14.723 |
 Yemen Yemen |
34,514.54 | 1.194 | 3,207 | 10.762 |
 Paraguay Paraguay |
32,040.1 | 4.543 | 8,221 | 3.897 |
 Romania Romania |
30,910 | 1.583 | 2,590 | 11.934 |
 Niger Niger |
30,646.21 | 1.428 | 1,210 | 25.327 |
 Bulgaria Bulgaria |
29,490 | 4.183 | 2,790 | 10.57 |
 Senegal Senegal |
28,378.74 | 1.805 | 3,081 | 9.211 |
 Peru Peru |
27,050.26 | 0.866 | 1,510 | 17.914 |
 Libya Libya |
26,609.76 | 4.112 | 1,752 | 15.188 |
 Sri Lanka Sri Lanka |
24,308 | 1.134 | 2,324 | 10.46 |
 Israel Israel |
23,980 | 2.692 | 1,228 | 19.528 |
 Ecuador Ecuador |
16,878.61 | 0.989 | 1,599 | 10.556 |
 Lebanon Lebanon |
15,944.01 | 2.617 | 1,965 | 8.114 |
 Laos Laos |
15,932.93 | 2.289 | 1,307 | 12.19 |
 South Africa South Africa |
13,684 | 0.237 | 1,476 | 9.271 |
 Hungary Hungary |
13,610 | 1.393 | 490 | 27.776 |
 Georgia Georgia |
10,700 | 2.869 | 400 | 26.75 |
 Canada Canada |
10,351 | 0.278 | 395 | 26.205 |
 Philippines Philippines |
8,626.99 | 0.081 | 1,321 | 6.531 |
 Moldova Moldova |
6,807 | 1.917 | 1,231 | 5.53 |
 Palestinian Territories Palestinian Territories |
6,697.74 | 1.472 | 157 | 42.661 |
 Cyprus Cyprus |
5,500 | 6.434 | 140 | 39.286 |
 Croatia Croatia |
4,980 | 1.188 | 170 | 29.294 |
 United Arab Emirates United Arab Emirates |
4,471.08 | 0.469 | 131 | 34.13 |
 Jamaica Jamaica |
3,844 | 1.409 | 230 | 16.713 |
 Panama Panama |
3,536.41 | 0.85 | 2,698 | 1.311 |
 Haiti Haiti |
3,408.61 | 0.307 | 242 | 14.085 |
 New Zealand New Zealand |
3,349.23 | 0.683 | 231 | 14.499 |
 El Salvador El Salvador |
2,938.66 | 0.442 | 118 | 24.904 |
 Guinea Guinea |
2,738.98 | 0.23 | 272 | 10.07 |
 Qatar Qatar |
2,642 | 1.078 | 94 | 28.106 |
 Uruguay Uruguay |
2,349.55 | 0.67 | 114 | 20.61 |
 Montenegro Montenegro |
2,258.51 | 3.629 | 81 | 27.883 |
 Malta Malta |
1,790 | 3.763 | 0 | ∞ |
 Bahrain Bahrain |
1,716 | 1.147 | 33 | 52 |
 Kuwait Kuwait |
1,155 | 0.273 | 31 | 37.258 |
 Macedonia Macedonia |
1,147.95 | 0.553 | 57 | 20.139 |
 Barbados Barbados |
1,135.13 | 3.964 | 48 | 23.649 |
 Austria Austria |
1,000 | 0.113 | 30 | 33.333 |
 Belize Belize |
871 | 2.2 | 65 | 13.4 |
 Namibia Namibia |
670.92 | 0.278 | 70 | 9.585 |
 Solomon Islands Solomon Islands |
587.12 | 0.88 | 33 | 17.792 |
 Zimbabwe Zimbabwe |
449.24 | 0.03 | 28 | 16.044 |
 Grenada Grenada |
406 | 3.929 | 24 | 16.917 |
 Slovenia Slovenia |
300 | 0.145 | 10 | 30 |
 Poland Poland |
300 | 0.008 | 0 | ∞ |
 Slovakia Slovakia |
250 | 0.046 | 20 | 12.5 |
 Djibouti Djibouti |
191.44 | 0.182 | 8 | 23.93 |
 Fiji Fiji |
57.4 | 0.065 | 5 | 11.48 |
 Switzerland Switzerland |
16 | 0.002 | 10 | 1.6 |
 Antigua and Barbuda Antigua and Barbuda |
7.76 | 0.09 | 1 | 7.76 |
Top Melon Producing Countries by Share
- China dominates with a substantial 47.6% of global production, highlighting its pivotal role in the industry.
- India's share is 5.07%, reflecting its considerable contribution within the top producers.
- Turkey holds 4.75% of the global melon market, underscoring its importance.
- Kazakhstan makes up 4.64%, indicating significant output from this region.
- Even though Canada's share is relatively small at 0.035%, it plays an essential part in North America’s melon production landscape.