Countries by Tomato production
Tomatoes are a vital agricultural product, cherished for their culinary versatility and nutritional value. They thrive in warm climates with well-drained soil, commonly grown in temperate regions worldwide. Derived from the latest 2023 data available in the Food and Agriculture Organization (FAO) stats database, this page provides insights into global tomato production.
Global Tomato Production
In 2023, the global production of tomatoes reached approximately 192 million tonnes. This represents a significant growth from around 28 million tonnes in 1961. Over the decades, the production has consistently increased, with notable expansions in the 1990s and early 2000s. Since the beginning of the record, global tomato production has grown nearly sevenfold.
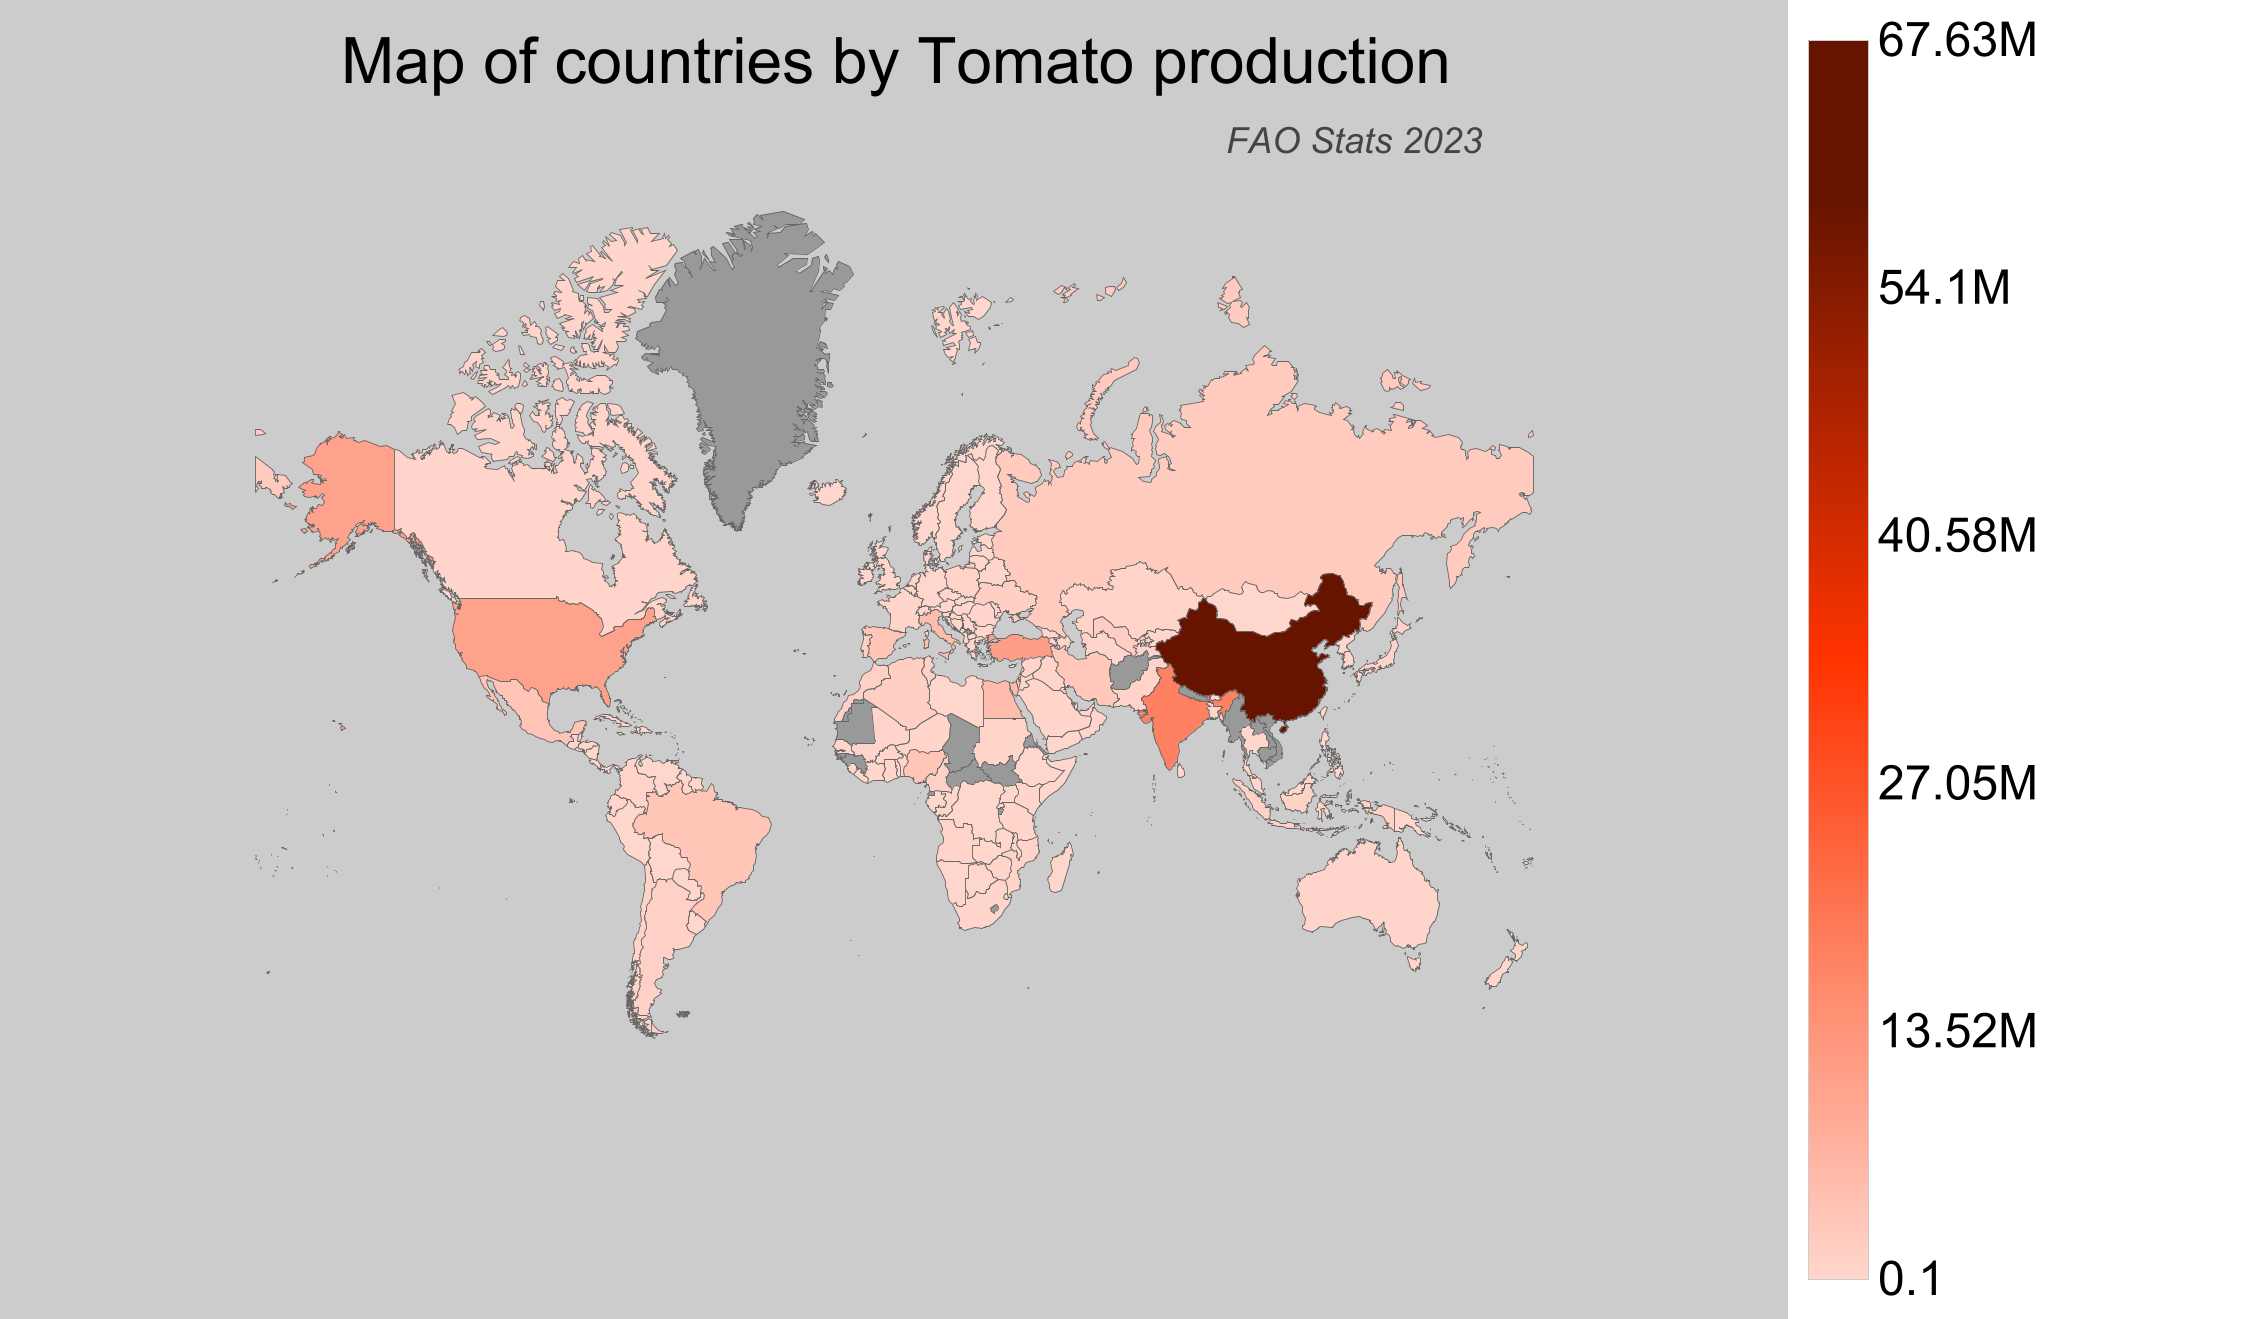
Tomato Production by Country
- China leads the global production with about 68 million tonnes, showcasing its dominant role in the market.
- India stands as the second-largest producer with a production volume of around 20 million tonnes.
- Turkey contributes significantly with a production of 13 million tonnes.
- The United States of America produces approximately 12 million tonnes, marking its importance in the sector.
- Canada, not among the top producers, produced approximately 543,000 tonnes, ranking 41st globally.
| Country | Production (tonnes) | Production per Person (kg) | Harvested Area (ha) | Yield (kg/ha) |
|---|---|---|---|---|
 China China |
67,636,724.84 | 48.525 | 1,144,821 | 59.081 |
 India India |
20,425,000 | 15.283 | 849,000 | 24.058 |
 Turkey Turkey |
13,300,000 | 155.788 | 166,323 | 79.965 |
 United States of America United States of America |
12,370,057 | 37.741 | 122,135 | 101.282 |
 Egypt Egypt |
6,211,015.96 | 63.705 | 155,874 | 39.846 |
 Italy Italy |
6,016,050 | 99.543 | 99,000 | 60.768 |
 Mexico Mexico |
4,394,806.98 | 35.232 | 89,637 | 49.029 |
 Brazil Brazil |
4,166,017 | 19.882 | 59,010 | 70.598 |
 Spain Spain |
3,968,460 | 85.052 | 50,090 | 79.227 |
 Nigeria Nigeria |
3,803,598.23 | 19.269 | 1,097,111 | 3.467 |
 Iran Iran |
3,367,599.2 | 41.19 | 73,559 | 45.781 |
 Russian Federation Russian Federation |
2,721,427.58 | 18.529 | 78,272 | 34.769 |
 Uzbekistan Uzbekistan |
2,205,700.31 | 67.548 | 65,095 | 33.884 |
 Portugal Portugal |
1,812,550 | 176.129 | 18,440 | 98.294 |
 Ukraine Ukraine |
1,683,560 | 39.834 | 60,900 | 27.645 |
 Algeria Algeria |
1,682,041.85 | 39.535 | 24,186 | 69.546 |
 Morocco Morocco |
1,444,678.6 | 41.544 | 14,675 | 98.445 |
 Argentina Argentina |
1,430,078.41 | 32.141 | 19,532 | 73.217 |
 Tunisia Tunisia |
1,287,545.34 | 112.486 | 21,036 | 61.207 |
 Cameroon Cameroon |
1,248,099.2 | 52.454 | 68,108 | 18.325 |
 Indonesia Indonesia |
1,143,787.67 | 4.316 | 61,255 | 18.673 |
 Mozambique Mozambique |
932,254 | 32.301 | 48,214 | 19.336 |
 Chile Chile |
930,111.41 | 52.925 | 12,754 | 72.927 |
 Colombia Colombia |
896,316.02 | 17.952 | 17,355 | 51.646 |
 Poland Poland |
883,200 | 22.98 | 8,500 | 103.906 |
 Azerbaijan Azerbaijan |
845,524.8 | 85.423 | 17,755 | 47.622 |
 Kazakhstan Kazakhstan |
792,359.76 | 43.364 | 28,888 | 27.429 |
 Angola Angola |
765,787 | 26.181 | 74,706 | 10.251 |
 Pakistan Pakistan |
762,736 | 3.778 | 68,863 | 11.076 |
 Greece Greece |
753,150 | 69.942 | 10,460 | 72.003 |
 Syria Syria |
740,699 | 40.51 | 12,054 | 61.448 |
 The Netherlands The Netherlands |
726,000 | 42.084 | 1,770 | 410.169 |
 Japan Japan |
711,724.06 | 5.627 | 11,252 | 63.253 |
 France France |
656,190 | 9.751 | 5,920 | 110.843 |
 Saudi Arabia Saudi Arabia |
636,645.79 | 19.053 | 14,597 | 43.615 |
 Sudan Sudan |
633,951.34 | 15.539 | 47,357 | 13.387 |
 Jordan Jordan |
591,726 | 57.836 | 7,734 | 76.51 |
 Kenya Kenya |
582,500 | 11.433 | 31,072 | 18.747 |
 Tanzania Tanzania |
571,816.04 | 10.55 | 41,149 | 13.896 |
 Malawi Malawi |
550,696.74 | 30.711 | 26,319 | 20.924 |
 Canada Canada |
543,051 | 14.593 | 6,068 | 89.494 |
 Iraq Iraq |
534,821 | 13.595 | 21,736 | 24.605 |
 South Africa South Africa |
527,954 | 9.146 | 8,044 | 65.633 |
 Guatemala Guatemala |
514,446.04 | 29.733 | 12,835 | 40.081 |
 Tajikistan Tajikistan |
509,859.82 | 57.089 | 15,575 | 32.736 |
 Bangladesh Bangladesh |
469,204 | 2.841 | 31,151 | 15.062 |
 Zimbabwe Zimbabwe |
459,036.5 | 30.914 | 20,393 | 22.51 |
 Niger Niger |
399,191.95 | 18.596 | 14,789 | 26.992 |
 South Korea South Korea |
390,041.54 | 7.554 | 6,262 | 62.287 |
 Ghana Ghana |
374,554.49 | 12.648 | 47,884 | 7.822 |
 Turkmenistan Turkmenistan |
346,147.36 | 59.156 | 10,045 | 34.46 |
 Belarus Belarus |
336,154.66 | 35.466 | 7,102 | 47.332 |
 Cuba Cuba |
335,704.47 | 29.917 | 38,393 | 8.744 |
 Israel Israel |
324,684 | 36.449 | 4,841 | 67.07 |
 Australia Australia |
321,736 | 12.844 | 4,055 | 79.343 |
 Albania Albania |
309,343.49 | 107.773 | 6,412 | 48.244 |
 Burkina Faso Burkina Faso |
306,281.86 | 15.129 | 17,932 | 17.08 |
 Dominican Republic Dominican Republic |
290,990 | 28.345 | 7,219 | 40.309 |
 Belgium Belgium |
289,700 | 25.375 | 640 | 452.656 |
 Oman Oman |
283,274 | 56.53 | 3,232 | 87.647 |
 Kyrgyzstan Kyrgyzstan |
280,794 | 44.505 | 11,946 | 23.505 |
 Benin Benin |
279,465.7 | 24.596 | 31,550 | 8.858 |
 Lebanon Lebanon |
271,997.48 | 44.637 | 6,552 | 41.514 |
 Romania Romania |
271,520 | 13.907 | 17,540 | 15.48 |
 Mali Mali |
246,195 | 12.885 | 12,985 | 18.96 |
 Libya Libya |
226,622.21 | 35.021 | 10,795 | 20.993 |
 Peru Peru |
225,946.49 | 7.233 | 5,212 | 43.351 |
 Philippines Philippines |
219,309.89 | 2.061 | 14,937 | 14.682 |
 Palestinian Territories Palestinian Territories |
189,404.85 | 41.627 | 1,157 | 163.703 |
 Venezuela Venezuela |
182,454.14 | 5.732 | 8,696 | 20.981 |
 Hungary Hungary |
177,390 | 18.155 | 1,780 | 99.657 |
 Malaysia Malaysia |
163,942.95 | 5.02 | 1,994 | 82.218 |
 Armenia Armenia |
158,626.9 | 53.413 | 3,836 | 41.352 |
 Senegal Senegal |
152,950.1 | 9.726 | 8,692 | 17.597 |
 Yemen Yemen |
150,696.5 | 5.212 | 9,466 | 15.92 |
 Thailand Thailand |
139,760 | 2.02 | 6,192 | 22.571 |
 Macedonia Macedonia |
116,383 | 56.08 | 5,666 | 20.541 |
 Bulgaria Bulgaria |
115,650 | 16.404 | 3,180 | 36.368 |
 Serbia Serbia |
113,912.92 | 16.27 | 7,782 | 14.638 |
 Germany Germany |
101,060 | 1.221 | 370 | 273.135 |
 Taiwan Taiwan |
98,340 | 4.171 | 4,103 | 23.968 |
 Bolivia Bolivia |
87,862.73 | 7.77 | 5,766 | 15.238 |
 Rwanda Rwanda |
84,353.7 | 7.029 | 9,937 | 8.489 |
 Sri Lanka Sri Lanka |
80,414 | 3.75 | 5,558 | 14.468 |
 United Arab Emirates United Arab Emirates |
77,867.15 | 8.161 | 914 | 85.194 |
 Nicaragua Nicaragua |
74,227.48 | 11.811 | 1,478 | 50.222 |
 Honduras Honduras |
72,971.34 | 8.097 | 893 | 81.715 |
 North Korea North Korea |
66,405.84 | 2.593 | 8,552 | 7.765 |
 Kuwait Kuwait |
66,094 | 15.636 | 483 | 136.841 |
 United Kingdom United Kingdom |
63,441.68 | 0.961 | 176 | 360.464 |
 Austria Austria |
56,950 | 6.444 | 200 | 284.75 |
 Costa Rica Costa Rica |
56,587.98 | 11.31 | 1,187 | 47.673 |
 Georgia Georgia |
55,500 | 14.881 | 3,200 | 17.344 |
 New Zealand New Zealand |
51,733.85 | 10.556 | 447 | 115.736 |
 Bosnia and Herzegovina Bosnia and Herzegovina |
51,075 | 13.496 | 2,270 | 22.5 |
 Congo-Kinshasa Congo-Kinshasa |
50,944.23 | 0.626 | 6,790 | 7.503 |
 Côte d'Ivoire Côte d'Ivoire |
48,258.53 | 1.938 | 4,623 | 10.439 |
 Moldova Moldova |
43,428 | 12.23 | 6,504 | 6.677 |
 Paraguay Paraguay |
42,341.52 | 6.003 | 1,422 | 29.776 |
 Madagascar Madagascar |
40,739.46 | 1.551 | 4,885 | 8.34 |
 Ecuador Ecuador |
40,078.81 | 2.348 | 1,366 | 29.34 |
 Uganda Uganda |
38,310.26 | 0.987 | 6,628 | 5.78 |
 Ethiopia Ethiopia |
36,103.13 | 0.336 | 7,318 | 4.933 |
 Uruguay Uruguay |
36,051.75 | 10.283 | 471 | 76.543 |
 Switzerland Switzerland |
35,501 | 4.18 | 179 | 198.33 |
 Finland Finland |
30,850 | 5.591 | 80 | 385.625 |
 Qatar Qatar |
27,682 | 11.297 | 382 | 72.466 |
 Guyana Guyana |
26,868 | 34.348 | 256 | 104.953 |
 Zambia Zambia |
25,960.59 | 1.537 | 2,668 | 9.73 |
 Jamaica Jamaica |
25,442 | 9.323 | 1,431 | 17.779 |
 Somalia Somalia |
24,038.92 | 1.583 | 16,500 | 1.457 |
 El Salvador El Salvador |
22,567.55 | 3.397 | 394 | 57.278 |
 Panama Panama |
22,444.95 | 5.397 | 710 | 31.613 |
 Croatia Croatia |
22,400 | 5.343 | 440 | 50.909 |
 Mauritius Mauritius |
20,383 | 16.114 | 626 | 32.561 |
 Czech Republic Czech Republic |
20,300 | 1.913 | 120 | 169.167 |
 Sierra Leone Sierra Leone |
19,733.83 | 2.556 | 2,225 | 8.869 |
 Slovakia Slovakia |
19,480 | 3.579 | 220 | 88.545 |
 Sweden Sweden |
17,480 | 1.719 | 40 | 437 |
 Norway Norway |
15,088 | 2.84 | 40 | 377.2 |
 Cyprus Cyprus |
12,970 | 15.173 | 280 | 46.321 |
 Comoros Comoros |
11,472.9 | 13.487 | 1,284 | 8.935 |
 Denmark Denmark |
11,390 | 1.967 | 30 | 379.667 |
 Malta Malta |
10,902 | 22.918 | 282 | 38.66 |
 Cape Verde Cape Verde |
9,987.37 | 18.356 | 400 | 24.968 |
 Bahrain Bahrain |
9,449 | 6.315 | 84 | 112.488 |
 Namibia Namibia |
8,842.81 | 3.664 | 1,430 | 6.184 |
 Lithuania Lithuania |
8,140 | 2.906 | 500 | 16.28 |
 Slovenia Slovenia |
8,070 | 3.904 | 180 | 44.833 |
 The Bahamas The Bahamas |
7,714.22 | 20.23 | 140 | 55.102 |
 Swaziland Swaziland |
5,288.02 | 4.562 | 417 | 12.681 |
 Togo Togo |
5,279.94 | 0.718 | 1,244 | 4.244 |
 Latvia Latvia |
5,200 | 2.7 | 0 | ∞ |
 Congo-Brazzaville Congo-Brazzaville |
3,873.15 | 0.717 | 820 | 4.723 |
 Liberia Liberia |
3,557.41 | 0.812 | 277 | 12.843 |
 Ireland Ireland |
3,510 | 0.723 | 10 | 351 |
 Fiji Fiji |
3,189.2 | 3.604 | 319 | 9.997 |
 Haiti Haiti |
2,303.95 | 0.207 | 150 | 15.36 |
 Mongolia Mongolia |
2,157.02 | 0.669 | 218 | 9.895 |
 Botswana Botswana |
2,047.57 | 0.889 | 66 | 31.024 |
 Montenegro Montenegro |
1,606.54 | 2.581 | 48 | 33.47 |
 Djibouti Djibouti |
1,584.94 | 1.511 | 348 | 4.554 |
 Belize Belize |
1,523 | 3.847 | 64 | 23.797 |
 Trinidad and Tobago Trinidad and Tobago |
1,372 | 1.011 | 72 | 19.056 |
 Iceland Iceland |
1,200 | 3.399 | 4 | 300 |
 Suriname Suriname |
930.33 | 1.637 | 50 | 18.607 |
 Tonga Tonga |
873.38 | 8.677 | 27 | 32.347 |
 Barbados Barbados |
841.22 | 2.937 | 45 | 18.694 |
 East Timor East Timor |
596.33 | 0.473 | 115 | 5.185 |
 Papua New Guinea Papua New Guinea |
539.26 | 0.063 | 131 | 4.116 |
 Vanuatu Vanuatu |
500 | 1.642 | 50 | 10 |
 Grenada Grenada |
455 | 4.403 | 61 | 7.459 |
 Seychelles Seychelles |
450.06 | 4.777 | 67 | 6.717 |
 Dominica Dominica |
421.34 | 5.91 | 36 | 11.704 |
 Gabon Gabon |
348.6 | 0.169 | 41 | 8.502 |
 Cook Islands Cook Islands |
280.53 | 15.082 | 10 | 28.053 |
 Saint Lucia Saint Lucia |
238 | 1.331 | 12 | 19.833 |
 Maldives Maldives |
230.22 | 0.609 | 14 | 16.444 |
 Bhutan Bhutan |
206.22 | 0.284 | 60 | 3.437 |
 Brunei Brunei |
141.08 | 0.334 | 11 | 12.825 |
 Luxembourg Luxembourg |
120 | 0.199 | 0 | ∞ |
 Saint Kitts and Nevis Saint Kitts and Nevis |
84 | 1.818 | 7 | 12 |
 Antigua and Barbuda Antigua and Barbuda |
80.89 | 0.937 | 9 | 8.988 |
 Estonia Estonia |
80 | 0.061 | 0 | ∞ |
 Nauru Nauru |
0.47 | 0.047 | 0 | ∞ |
 Singapore Singapore |
0.1 | 0 | 0 | ∞ |
Top Tomato Producing Countries by Share
- China alone accounts for approximately 35% of the global tomato production, emphasizing its massive contribution.
- India holds a significant share with about 11% of the global total.
- Turkey and the United States of America contribute around 7% and 6% respectively, highlighting their roles in the global market.
- Canada, while producing only a small fraction, contributes around 0.28% to the worldwide production.