Countries by Pineapple production
Pineapple is a vital tropical fruit known for its sweet flavor and nutritional benefits, making it popular worldwide. It thrives in warm climates, typically in tropical and subtropical regions, providing economic and agricultural significance to many countries. According to the Food and Agriculture Organization (FAO) stats, the data provided for the year 2023 presents the latest insights into global pineapple production as of 2025, highlighting important details on global trends and key contributors.
Global Pineapple Production
In 2023, the global production of pineapples reached approximately 29.6 million tonnes. Since 1961, when the recorded production was around 3.8 million tonnes, there has been a striking upward trend. Over the decades, global production has increased steadily, peaking at nearly 30 million tonnes by 2023. This growth underscores the growing demand for pineapples worldwide and the efficiency improvements in pineapple farming and distribution. Notably, production has seen a near eightfold increase from the beginning of the recorded data to 2023.
Pineapple Production by Country
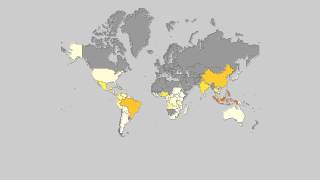
- Indonesia topped the charts with around 3.2 million tonnes of pineapple production in 2023.
- The Philippines produced approximately 2.9 million tonnes, showcasing its critical role in the pineapple industry.
- Costa Rica also contributed significantly with about 2.9 million tonnes.
- Brazil followed with a production volume of roughly 2.4 million tonnes in 2023.
- Canada is not listed in FAO statistics as a producer of pineapples due to its unsuitable climate for commercial pineapple farming.
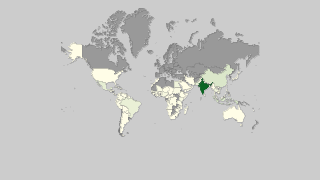
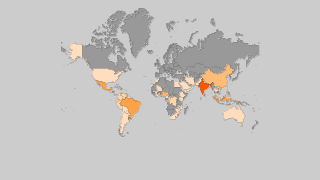
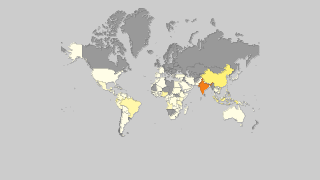
| Country | Production (tonnes) | Production per Person (kg) | Harvested Area (ha) | Yield (kg/ha) |
|---|---|---|---|---|
 Indonesia Indonesia |
3,156,576.45 | 11.911 | 23,550 | 134.037 |
 Philippines Philippines |
2,944,259.54 | 27.669 | 69,149 | 42.578 |
 Costa Rica Costa Rica |
2,937,807 | 587.163 | 40,000 | 73.445 |
 Brazil Brazil |
2,387,393 | 11.394 | 63,943 | 37.336 |
 China China |
2,301,836 | 1.651 | 75,340 | 30.553 |
 India India |
1,828,000 | 1.368 | 108,000 | 16.926 |
 Nigeria Nigeria |
1,615,621.53 | 8.185 | 196,840 | 8.208 |
 Mexico Mexico |
1,272,559.15 | 10.202 | 25,960 | 49.02 |
 Thailand Thailand |
1,258,028 | 18.184 | 54,586 | 23.047 |
 Colombia Colombia |
853,169.37 | 17.088 | 22,526 | 37.875 |
 Vietnam Vietnam |
780,557.6 | 8.246 | 41,620 | 18.754 |
 Angola Angola |
759,158 | 25.954 | 38,067 | 19.943 |
 Dominican Republic Dominican Republic |
748,353.62 | 72.895 | 8,506 | 87.979 |
 Ghana Ghana |
688,062.72 | 23.234 | 10,196 | 67.484 |
 Peru Peru |
583,620.29 | 18.683 | 16,435 | 35.511 |
 Ecuador Ecuador |
507,987.49 | 29.765 | 6,374 | 79.697 |
 Benin Benin |
477,427.8 | 42.019 | 6,957 | 68.626 |
 Venezuela Venezuela |
477,039.68 | 14.988 | 22,553 | 21.152 |
 Tanzania Tanzania |
443,910.5 | 8.19 | 18,136 | 24.477 |
 Taiwan Taiwan |
402,836 | 17.086 | 7,797 | 51.666 |
 Malaysia Malaysia |
392,344.16 | 12.015 | 16,851 | 23.283 |
 Guatemala Guatemala |
388,361.83 | 22.446 | 13,726 | 28.294 |
 Malawi Malawi |
343,438.08 | 19.153 | 11,015 | 31.179 |
 Cameroon Cameroon |
310,771.41 | 13.061 | 11,854 | 26.217 |
 Bangladesh Bangladesh |
196,735 | 1.191 | 13,143 | 14.969 |
 Congo-Kinshasa Congo-Kinshasa |
188,998 | 2.324 | 7,780 | 24.293 |
 United States of America United States of America |
168,208.2 | 0.513 | 5,603 | 30.021 |
 South Africa South Africa |
128,419.58 | 2.225 | 10,667 | 12.039 |
 Panama Panama |
123,924.29 | 29.798 | 2,095 | 59.152 |
 Kenya Kenya |
97,400 | 1.912 | 4,706 | 20.697 |
 Madagascar Madagascar |
87,686.75 | 3.339 | 15,696 | 5.587 |
 Bolivia Bolivia |
87,084.23 | 7.702 | 5,129 | 16.979 |
 Honduras Honduras |
77,030.4 | 8.547 | 1,522 | 50.611 |
 Guinea Guinea |
74,174.73 | 6.242 | 17,222 | 4.307 |
 Paraguay Paraguay |
72,889.11 | 10.335 | 5,357 | 13.606 |
 Australia Australia |
72,178 | 2.881 | 1,842 | 39.185 |
 Nicaragua Nicaragua |
68,647.81 | 10.923 | 4,615 | 14.875 |
 Laos Laos |
67,123.17 | 9.642 | 5,026 | 13.355 |
 Mozambique Mozambique |
56,175.41 | 1.946 | 8,514 | 6.598 |
 Jamaica Jamaica |
49,149 | 18.011 | 2,696 | 18.23 |
 Sri Lanka Sri Lanka |
45,325 | 2.114 | 4,155 | 10.909 |
 Guyana Guyana |
35,576 | 45.481 | 902 | 39.441 |
 Côte d'Ivoire Côte d'Ivoire |
34,806.14 | 1.398 | 553 | 62.941 |
 Cuba Cuba |
28,490.86 | 2.539 | 5,890 | 4.837 |
 Cambodia Cambodia |
24,219.21 | 1.507 | 2,312 | 10.475 |
 Papua New Guinea Papua New Guinea |
23,729.99 | 2.773 | 1,218 | 19.483 |
 Rwanda Rwanda |
23,341.26 | 1.945 | 4,020 | 5.806 |
 Swaziland Swaziland |
21,203.57 | 18.291 | 727 | 29.166 |
 Central African Republic Central African Republic |
16,040.31 | 3.386 | 3,633 | 4.415 |
 Zambia Zambia |
10,700.63 | 0.634 | 1,376 | 7.777 |
 Nepal Nepal |
9,740.51 | 0.333 | 868 | 11.222 |
 Liberia Liberia |
9,366.65 | 2.137 | 1,709 | 5.481 |
 Zimbabwe Zimbabwe |
8,887.82 | 0.599 | 610 | 14.57 |
 Fiji Fiji |
8,590.8 | 9.708 | 1,227 | 7.001 |
 Uganda Uganda |
8,188.07 | 0.211 | 964 | 8.494 |
 Japan Japan |
7,742.74 | 0.061 | 324 | 23.897 |
 Haiti Haiti |
7,206.38 | 0.648 | 600 | 12.011 |
 Israel Israel |
6,309 | 0.708 | 162 | 38.944 |
 Mauritius Mauritius |
5,918 | 4.679 | 293 | 20.198 |
 Suriname Suriname |
4,671.51 | 8.22 | 224 | 20.855 |
 Samoa Samoa |
4,620.82 | 23.214 | 162 | 28.524 |
 Belize Belize |
4,258 | 10.756 | 333 | 12.787 |
 South Sudan South Sudan |
4,215.39 | 0.342 | 1,112 | 3.791 |
 Sudan Sudan |
3,908 | 0.096 | 878 | 4.451 |
 Vanuatu Vanuatu |
3,800 | 12.479 | 540 | 7.037 |
 Congo-Brazzaville Congo-Brazzaville |
3,748.6 | 0.694 | 1,021 | 3.671 |
 Argentina Argentina |
3,236.78 | 0.073 | 179 | 18.083 |
 Dominica Dominica |
2,350.44 | 32.969 | 115 | 20.439 |
 Ethiopia Ethiopia |
1,971.29 | 0.018 | 831 | 2.372 |
 Togo Togo |
1,901.21 | 0.259 | 237 | 8.022 |
 Brunei Brunei |
1,265.53 | 2.994 | 145 | 8.728 |
 Gabon Gabon |
1,262.19 | 0.61 | 181 | 6.973 |
 El Salvador El Salvador |
1,087.92 | 0.164 | 46 | 23.65 |
 South Korea South Korea |
970.37 | 0.019 | 33 | 29.405 |
 Trinidad and Tobago Trinidad and Tobago |
950 | 0.7 | 238 | 3.992 |
 Portugal Portugal |
948 | 0.092 | 56 | 16.929 |
 Guinea-Bissau Guinea-Bissau |
409.18 | 0.258 | 105 | 3.897 |
 Bhutan Bhutan |
139.35 | 0.192 | 13 | 10.719 |
 East Timor East Timor |
135.51 | 0.107 | 10 | 13.551 |
 Saint Lucia Saint Lucia |
60 | 0.335 | 3 | 20 |
 Grenada Grenada |
47 | 0.455 | 4 | 11.75 |
 Seychelles Seychelles |
32.03 | 0.34 | 2 | 16.015 |
 Cook Islands Cook Islands |
16.66 | 0.896 | 6 | 2.777 |
 Saint Kitts and Nevis Saint Kitts and Nevis |
8 | 0.173 | 1 | 8 |
 Antigua and Barbuda Antigua and Barbuda |
1.36 | 0.016 | 1 | 1.36 |
Top Pineapple Producing Countries by Share
- Indonesia commands an impressive 10.65% of the global pineapple production share, highlighted as a major player in the market.
- The Philippines holds close to 9.93% of the global production, reinforcing its standing in the industry.
- Costa Rica is not far behind, contributing about 9.91% to the total global production.
- Brazil accounts for 8.06% of the world's pineapple output, making it an essential contributor.
- These four countries together produce a substantial portion of the global pineapple supply, showcasing the concentration of production in select geographic areas.


