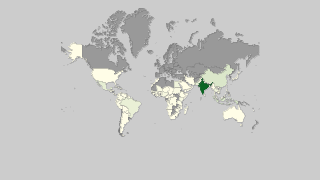
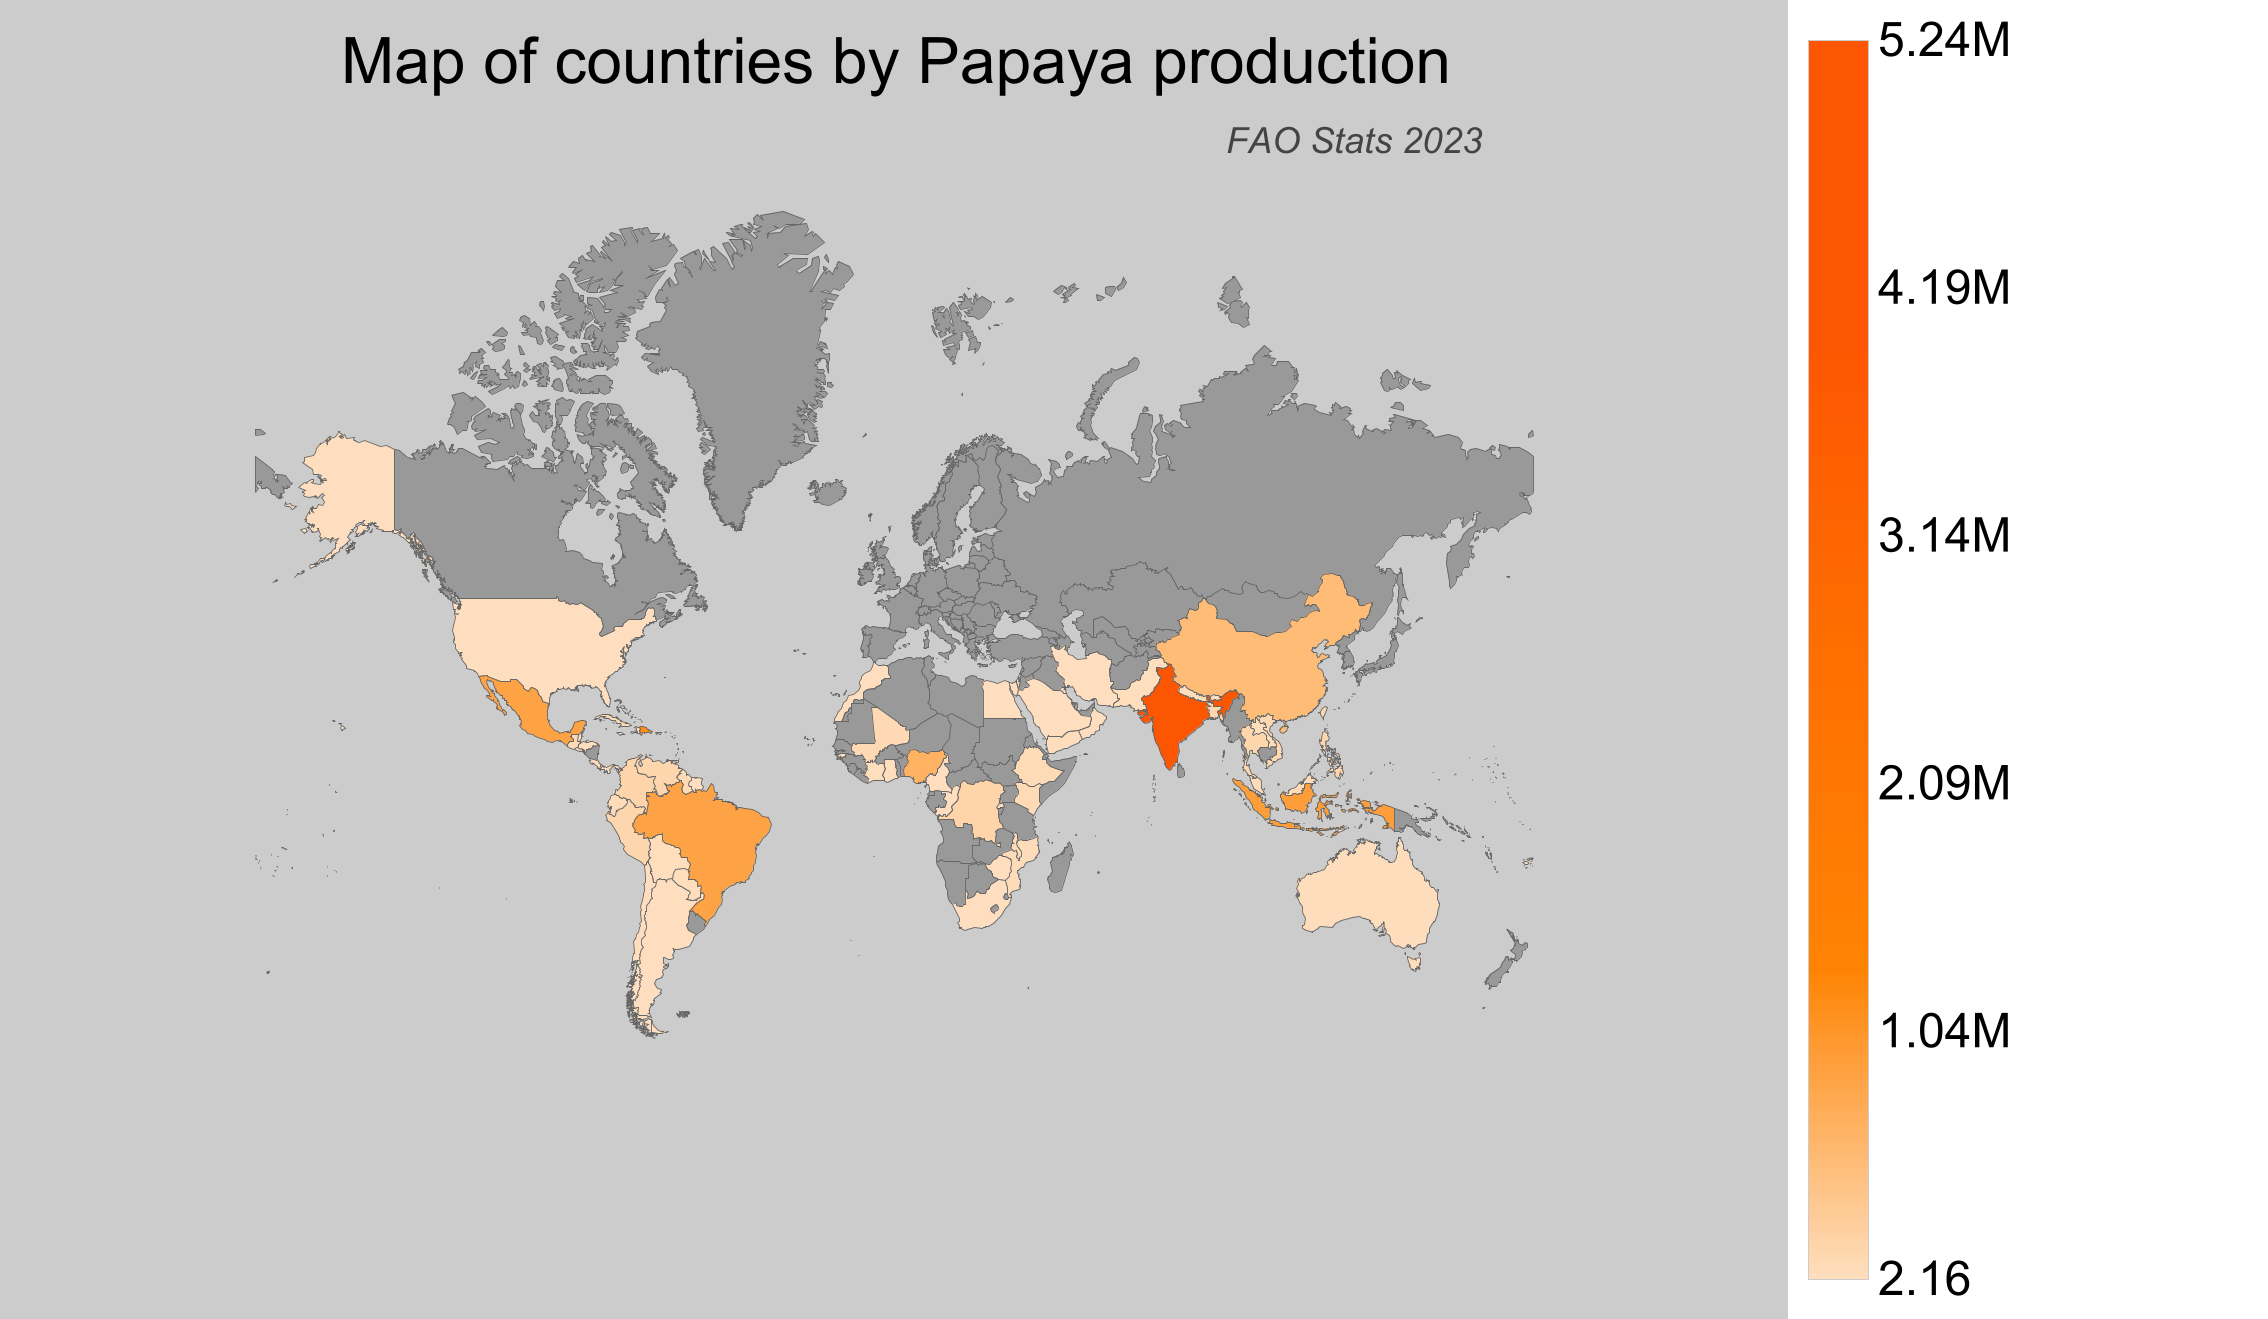
Countries by Papaya production
Papaya is a tropical fruit valued for its nutritional benefits, including vitamins A, C, and E. It thrives in warm, tropical climates with well-drained soil and is commonly cultivated in regions near the equator. The importance of papaya extends beyond its nutritional value, contributing to the economies of producing regions. This data for the year 2023 represents the latest available statistics in the Food and Agriculture Organization (FAO) database as of 2025.
Global Papaya Production
In 2023, the global production of papaya reached around 14.23 million tonnes, marking a consistent upward trend since 1961, when production was just over 1.3 million tonnes. This growth highlights the increasing demand and successful cultivation practices worldwide. Notably, from 1961 to 2023, global production has increased over tenfold, demonstrating significant advancements in agricultural practices and expanded cultivation areas.
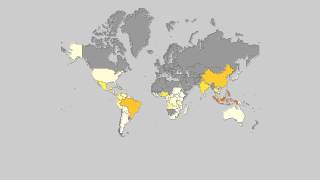
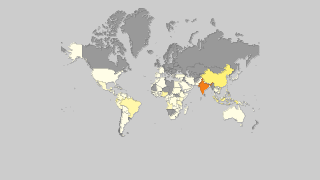
Papaya Production by Country
- India is the leading producer of papaya, with around 5.24 million tonnes in 2023.
- The Dominican Republic follows with production of about 1.59 million tonnes.
- Indonesia also makes a significant contribution, producing approximately 1.24 million tonnes.
- Mexico rounds out the top four with a production volume of around 1.15 million tonnes.
- According to FAO stats, Canada does not produce any papaya.
| Country | Production (tonnes) | Production per Person (kg) | Harvested Area (ha) | Yield (kg/ha) |
|---|---|---|---|---|
 India India |
5,240,000 | 3.921 | 148,000 | 35.405 |
 Dominican Republic Dominican Republic |
1,586,784.27 | 154.565 | 11,569 | 137.158 |
 Indonesia Indonesia |
1,238,692.13 | 4.674 | 12,541 | 98.771 |
 Mexico Mexico |
1,148,545.61 | 9.208 | 20,334 | 56.484 |
 Brazil Brazil |
1,138,343 | 5.433 | 26,839 | 42.414 |
 Nigeria Nigeria |
863,270.12 | 4.373 | 95,958 | 8.996 |
 China China |
668,834 | 0.48 | 10,680 | 62.625 |
 Congo-Kinshasa Congo-Kinshasa |
208,892.99 | 2.568 | 12,325 | 16.949 |
 Colombia Colombia |
178,470.72 | 3.574 | 8,085 | 22.074 |
 Peru Peru |
166,991.99 | 5.346 | 13,200 | 12.651 |
 Thailand Thailand |
162,075.32 | 2.343 | 4,060 | 39.92 |
 Venezuela Venezuela |
159,081.95 | 4.998 | 8,602 | 18.494 |
 Philippines Philippines |
156,520.71 | 1.471 | 7,786 | 20.103 |
 Bangladesh Bangladesh |
145,316 | 0.88 | 7,280 | 19.961 |
 Vietnam Vietnam |
132,440.91 | 1.399 | 9,335 | 14.188 |
 Taiwan Taiwan |
118,834 | 5.04 | 2,680 | 44.341 |
 Mali Mali |
96,841 | 5.068 | 4,792 | 20.209 |
 Cuba Cuba |
88,903.2 | 7.923 | 4,412 | 20.15 |
 Guatemala Guatemala |
85,002.36 | 4.913 | 2,841 | 29.92 |
 Kenya Kenya |
81,096.24 | 1.592 | 5,940 | 13.653 |
 Guyana Guyana |
79,295.17 | 101.371 | 231 | 343.269 |
 Ethiopia Ethiopia |
65,622.94 | 0.61 | 4,750 | 13.815 |
 Costa Rica Costa Rica |
64,206.12 | 12.833 | 1,000 | 64.206 |
 Malawi Malawi |
60,731.41 | 3.387 | 5,023 | 12.091 |
 Ecuador Ecuador |
47,892.96 | 2.806 | 3,758 | 12.744 |
 Mozambique Mozambique |
43,210.24 | 1.497 | 4,317 | 10.009 |
 Malaysia Malaysia |
38,883.06 | 1.191 | 2,373 | 16.386 |
 Haiti Haiti |
29,258.58 | 2.633 | 1,477 | 19.809 |
 Laos Laos |
28,740.24 | 4.129 | 2,939 | 9.779 |
 Yemen Yemen |
23,037.91 | 0.797 | 1,450 | 15.888 |
 Australia Australia |
21,760 | 0.869 | 1,137 | 19.138 |
 Bolivia Bolivia |
18,097.64 | 1.601 | 2,364 | 7.656 |
 Panama Panama |
14,627.67 | 3.517 | 366 | 39.966 |
 Nepal Nepal |
14,551.38 | 0.498 | 1,271 | 11.449 |
 Côte d'Ivoire Côte d'Ivoire |
14,529.94 | 0.583 | 5,817 | 2.498 |
 Pakistan Pakistan |
12,258 | 0.061 | 1,667 | 7.353 |
 Paraguay Paraguay |
11,245.33 | 1.594 | 1,103 | 10.195 |
 Jamaica Jamaica |
10,300 | 3.774 | 483 | 21.325 |
 South Africa South Africa |
7,633.4 | 0.132 | 837 | 9.12 |
 Fiji Fiji |
6,932.3 | 7.834 | 1,155 | 6.002 |
 Oman Oman |
5,838 | 1.165 | 294 | 19.857 |
 Ghana Ghana |
5,711.52 | 0.193 | 1,635 | 3.493 |
 Saudi Arabia Saudi Arabia |
4,800 | 0.144 | 141 | 34.043 |
 United States of America United States of America |
4,650 | 0.014 | 263 | 17.681 |
 Congo-Brazzaville Congo-Brazzaville |
3,864.05 | 0.716 | 229 | 16.874 |
 Samoa Samoa |
3,311 | 16.634 | 240 | 13.796 |
 Guinea-Bissau Guinea-Bissau |
3,113.5 | 1.965 | 332 | 9.378 |
 Morocco Morocco |
3,000 | 0.086 | 60 | 50 |
 Argentina Argentina |
2,214.95 | 0.05 | 205 | 10.805 |
 East Timor East Timor |
2,213.6 | 1.755 | 95 | 23.301 |
 Chile Chile |
2,122.71 | 0.121 | 135 | 15.724 |
 Israel Israel |
1,909 | 0.214 | 235 | 8.123 |
 El Salvador El Salvador |
1,535.03 | 0.231 | 49 | 31.327 |
 Maldives Maldives |
804.82 | 2.129 | 150 | 5.365 |
 Trinidad and Tobago Trinidad and Tobago |
648 | 0.478 | 51 | 12.706 |
 The Bahamas The Bahamas |
595.18 | 1.561 | 37 | 16.086 |
 Suriname Suriname |
586.67 | 1.032 | 31 | 18.925 |
 Cook Islands Cook Islands |
581.3 | 31.253 | 70 | 8.304 |
 Belize Belize |
402 | 1.015 | 12 | 33.5 |
 Honduras Honduras |
349.17 | 0.039 | 12 | 29.098 |
 Iran Iran |
302.43 | 0.004 | 29 | 10.429 |
 Rwanda Rwanda |
294.88 | 0.025 | 32 | 9.215 |
 Bhutan Bhutan |
132.05 | 0.182 | 54 | 2.445 |
 Egypt Egypt |
110 | 0.001 | 15 | 7.333 |
 Dominica Dominica |
91.16 | 1.279 | 6 | 15.193 |
 Kuwait Kuwait |
62 | 0.015 | 3 | 20.667 |
 Cameroon Cameroon |
49.39 | 0.002 | 3 | 16.463 |
 Zimbabwe Zimbabwe |
46.53 | 0.003 | 13 | 3.579 |
 Nauru Nauru |
2.16 | 0.214 | 0 | ∞ |
Top Papaya Producing Countries by Share
- India alone accounts for approximately 36.8% of global papaya production, a dominant share.
- The Dominican Republic contributes to about 11.1% of the global papaya supply.
- Indonesia's share stands at around 8.7% of world production.
- Mexico produces about 8.1% of the global total, making it a key player.
- The large share by a few countries indicates concentrated production in certain regions.