Countries by Mango and Guava production
Mango and Guava are significant fruits in the global agricultural landscape, celebrated for their nutritional benefits and unique flavors. They grow predominantly in tropical and subtropical climates, thriving in regions with ample sunshine and warmth. This data for the year 2023 highlights the critical role these fruits play in both local and international markets. Drawn from the Food and Agriculture Organization (FAO) stats database, this analysis provides the latest insights as of 2025.
Global Mango and Guava Production
In 2023, the world produced around 61 million tonnes of Mango and Guava. Over the decades, global production has shown a steady upward trend since 1961, when production was around 10.9 million tonnes. The increase from 10.9 million tonnes in 1961 to 61 million tonnes in 2023 underscores significant growth, driven by expanding cultivation areas and improved agricultural practices.
Mango and Guava Production by Country
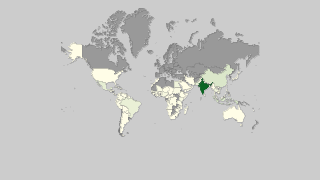
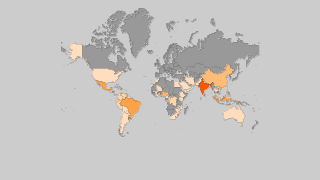
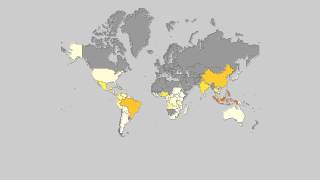
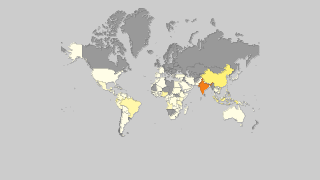
- India leads the world in Mango and Guava production with around 26 million tonnes in 2023.
- Indonesia follows with a production of approximately 4.1 million tonnes.
- China is another major producer, contributing about 4 million tonnes.
- Mexico rounds up the list with around 2.7 million tonnes.
- Canada, according to FAO stats, does not produce Mango and Guava due to its unsuitable climate.
| Country | Production (tonnes) | Production per Person (kg) | Harvested Area (ha) | Yield (kg/ha) |
|---|---|---|---|---|
 India India |
26,236,000 | 19.631 | 2,698,000 | 9.724 |
 Indonesia Indonesia |
4,104,448.7 | 15.488 | 298,827 | 13.735 |
 China China |
3,961,662 | 2.842 | 386,165 | 10.259 |
 Mexico Mexico |
2,706,107.45 | 21.694 | 236,374 | 11.448 |
 Pakistan Pakistan |
2,594,328 | 12.851 | 213,496 | 12.152 |
 Brazil Brazil |
2,340,950 | 11.172 | 102,952 | 22.738 |
 Malawi Malawi |
2,131,449.09 | 118.865 | 60,099 | 35.466 |
 Egypt Egypt |
1,715,365 | 17.594 | 161,928 | 10.593 |
 Thailand Thailand |
1,618,789 | 23.399 | 131,714 | 12.29 |
 Bangladesh Bangladesh |
1,508,547 | 9.136 | 142,373 | 10.596 |
 Vietnam Vietnam |
1,498,205.69 | 15.827 | 123,157 | 12.165 |
 Nigeria Nigeria |
954,198.57 | 4.834 | 131,033 | 7.282 |
 Kenya Kenya |
909,900 | 17.858 | 76,790 | 11.849 |
 Philippines Philippines |
799,247.49 | 7.511 | 199,710 | 4.002 |
 Sudan Sudan |
726,158.57 | 17.799 | 35,238 | 20.607 |
 Mali Mali |
676,532 | 35.406 | 47,313 | 14.299 |
 Nepal Nepal |
538,523 | 18.431 | 45,114 | 11.937 |
 Colombia Colombia |
535,384.41 | 10.723 | 49,397 | 10.838 |
 Tanzania Tanzania |
459,734.96 | 8.482 | 33,843 | 13.584 |
 Cuba Cuba |
446,252.7 | 39.769 | 37,399 | 11.932 |
 Peru Peru |
392,671.07 | 12.571 | 33,800 | 11.617 |
 Yemen Yemen |
378,030.7 | 13.074 | 25,293 | 14.946 |
 Congo-Kinshasa Congo-Kinshasa |
309,682.91 | 3.807 | 18,166 | 17.047 |
 Madagascar Madagascar |
307,158.01 | 11.696 | 49,999 | 6.143 |
 Angola Angola |
288,559 | 9.865 | 25,717 | 11.221 |
 Haiti Haiti |
223,095.04 | 20.075 | 29,124 | 7.66 |
 Côte d'Ivoire Côte d'Ivoire |
207,661.27 | 8.338 | 347,299 | 0.598 |
 Guinea Guinea |
206,209.13 | 17.353 | 102,538 | 2.011 |
 Sri Lanka Sri Lanka |
194,077 | 9.05 | 29,453 | 6.589 |
 Guatemala Guatemala |
185,845.27 | 10.741 | 14,139 | 13.144 |
 Taiwan Taiwan |
171,662 | 7.281 | 16,165 | 10.619 |
 Niger Niger |
167,234.8 | 7.79 | 41,407 | 4.039 |
 Ethiopia Ethiopia |
143,985.9 | 1.339 | 31,756 | 4.534 |
 Zimbabwe Zimbabwe |
141,221.02 | 9.511 | 4,964 | 28.449 |
 Venezuela Venezuela |
122,368.06 | 3.845 | 9,128 | 13.406 |
 Senegal Senegal |
122,365.26 | 7.781 | 18,132 | 6.749 |
 Ghana Ghana |
103,095.17 | 3.481 | 7,070 | 14.582 |
 Saudi Arabia Saudi Arabia |
95,000 | 2.843 | 7,265 | 13.076 |
 Dominican Republic Dominican Republic |
92,277.85 | 8.989 | 5,873 | 15.712 |
 South Africa South Africa |
92,186.42 | 1.597 | 4,992 | 18.467 |
 Ecuador Ecuador |
78,361.41 | 4.592 | 16,287 | 4.811 |
 Australia Australia |
74,900 | 2.99 | 18,302 | 4.092 |
 Cambodia Cambodia |
66,533.25 | 4.14 | 4,931 | 13.493 |
 Israel Israel |
61,040 | 6.852 | 2,140 | 28.523 |
 Malaysia Malaysia |
60,930.35 | 1.866 | 9,032 | 6.746 |
 El Salvador El Salvador |
53,867.41 | 8.108 | 2,709 | 19.885 |
 Iran Iran |
45,458.95 | 0.556 | 8,569 | 5.305 |
 Congo-Brazzaville Congo-Brazzaville |
37,953.68 | 7.029 | 5,031 | 7.544 |
 Chad Chad |
36,535.22 | 2.38 | 8,639 | 4.229 |
 Paraguay Paraguay |
34,415.11 | 4.88 | 4,450 | 7.734 |
 Costa Rica Costa Rica |
33,162.56 | 6.628 | 3,705 | 8.951 |
 Mozambique Mozambique |
27,829.07 | 0.964 | 5,109 | 5.447 |
 Sierra Leone Sierra Leone |
22,220.6 | 2.878 | 6,665 | 3.334 |
 Myanmar Myanmar |
20,625.81 | 0.383 | 2,896 | 7.122 |
 Bolivia Bolivia |
17,575.55 | 1.554 | 2,142 | 8.205 |
 Benin Benin |
16,349.52 | 1.439 | 3,446 | 4.744 |
 Oman Oman |
16,058 | 3.205 | 1,525 | 10.53 |
 Burkina Faso Burkina Faso |
14,607.94 | 0.722 | 1,561 | 9.358 |
 Central African Republic Central African Republic |
12,738.39 | 2.689 | 2,633 | 4.838 |
 Guinea-Bissau Guinea-Bissau |
9,320.53 | 5.881 | 962 | 9.689 |
 Vanuatu Vanuatu |
7,600 | 24.959 | 1,500 | 5.067 |
 East Timor East Timor |
7,476.93 | 5.927 | 778 | 9.61 |
 Panama Panama |
5,811.65 | 1.397 | 481 | 12.082 |
 United Arab Emirates United Arab Emirates |
5,484.51 | 0.575 | 181 | 30.301 |
 Jordan Jordan |
5,383 | 0.526 | 424 | 12.696 |
 Laos Laos |
4,876.18 | 0.7 | 593 | 8.223 |
 Guyana Guyana |
4,659 | 5.956 | 86 | 54.174 |
 Samoa Samoa |
4,290.55 | 21.555 | 125 | 34.324 |
 Palestinian Territories Palestinian Territories |
3,993.88 | 0.878 | 360 | 11.094 |
 Japan Japan |
3,518.68 | 0.028 | 457 | 7.7 |
 Trinidad and Tobago Trinidad and Tobago |
3,384.73 | 2.495 | 173 | 19.565 |
 Jamaica Jamaica |
2,790 | 1.022 | 513 | 5.439 |
 The Bahamas The Bahamas |
2,657.36 | 6.969 | 149 | 17.835 |
 Argentina Argentina |
2,243.06 | 0.05 | 279 | 8.04 |
 Dominica Dominica |
2,119.59 | 29.731 | 2,400 | 0.883 |
 Suriname Suriname |
1,642.45 | 2.89 | 110 | 14.931 |
 United States of America United States of America |
1,500 | 0.005 | 75 | 20 |
 Gambia Gambia |
1,448.59 | 0.706 | 262 | 5.529 |
 Grenada Grenada |
1,444.56 | 13.98 | 257 | 5.621 |
 Antigua and Barbuda Antigua and Barbuda |
1,410.54 | 16.346 | 310 | 4.55 |
 Saint Vincent and the Grenadines Saint Vincent and the Grenadines |
1,328 | 12.122 | 66 | 20.121 |
 Somalia Somalia |
1,272.09 | 0.084 | 510 | 2.494 |
 Bhutan Bhutan |
1,125.88 | 1.548 | 467 | 2.411 |
 Cameroon Cameroon |
891.26 | 0.037 | 152 | 5.864 |
 Cape Verde Cape Verde |
756 | 1.389 | 63 | 12 |
 Saint Lucia Saint Lucia |
713 | 3.987 | 65 | 10.969 |
 Fiji Fiji |
698.8 | 0.79 | 140 | 4.991 |
 Djibouti Djibouti |
622.74 | 0.594 | 113 | 5.511 |
 Honduras Honduras |
542.27 | 0.06 | 25 | 21.691 |
 Rwanda Rwanda |
481.49 | 0.04 | 134 | 3.593 |
 Cook Islands Cook Islands |
254.22 | 13.668 | 29 | 8.766 |
 Swaziland Swaziland |
240.73 | 0.208 | 116 | 2.075 |
 Namibia Namibia |
189.68 | 0.079 | 26 | 7.295 |
 Morocco Morocco |
169.38 | 0.005 | 32 | 5.293 |
 Seychelles Seychelles |
70.64 | 0.75 | 8 | 8.83 |
 Kuwait Kuwait |
53.28 | 0.013 | 7 | 7.611 |
 Belize Belize |
36 | 0.091 | 5 | 7.2 |
 Maldives Maldives |
27.45 | 0.073 | 6 | 4.575 |
 Qatar Qatar |
10 | 0.004 | 3 | 3.333 |
Top Mango and Guava Producing Countries by Share
- India alone accounts for nearly 43% of the global production of Mango and Guava, emphasizing its substantial dominance in the market.
- Indonesia contributes about 6.7% to the global production, highlighting its role as a significant player.
- China's production share stands at approximately 6.5%, underscoring its position as a key producer.
- Mexico's share of the global production is around 4.4%, marking its presence in the top tier of producers.


