Countries by Pear production
Pears are a beloved fruit worldwide, offering a unique blend of sweetness and juiciness that delights consumers. This versatile fruit thrives in temperate climates, making it suitable for regions with well-defined seasons. According to the Food and Agriculture Organization (FAO), the latest available data as of 2025 highlights pear production statistics for 2023, revealing the key players in this vital agricultural sector.
Global Pear Production
In 2023, the global pear production reached around 26.5 million tonnes. Over the decades, there has been a significant rise from approximately 5.2 million tonnes in 1961 to around 26.5 million tonnes in 2023, highlighting a strong upward trend. The most notable growth occurred in the late 1990s through the 2000s. Between 1961 and 2023, global production witnessed a more than fivefold increase, emphasizing the growing importance and demand for pears.
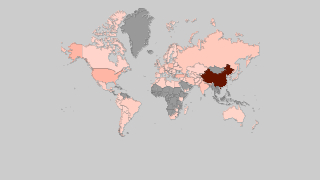
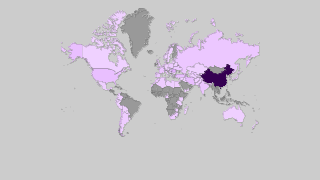
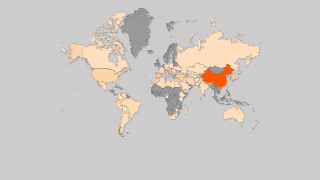
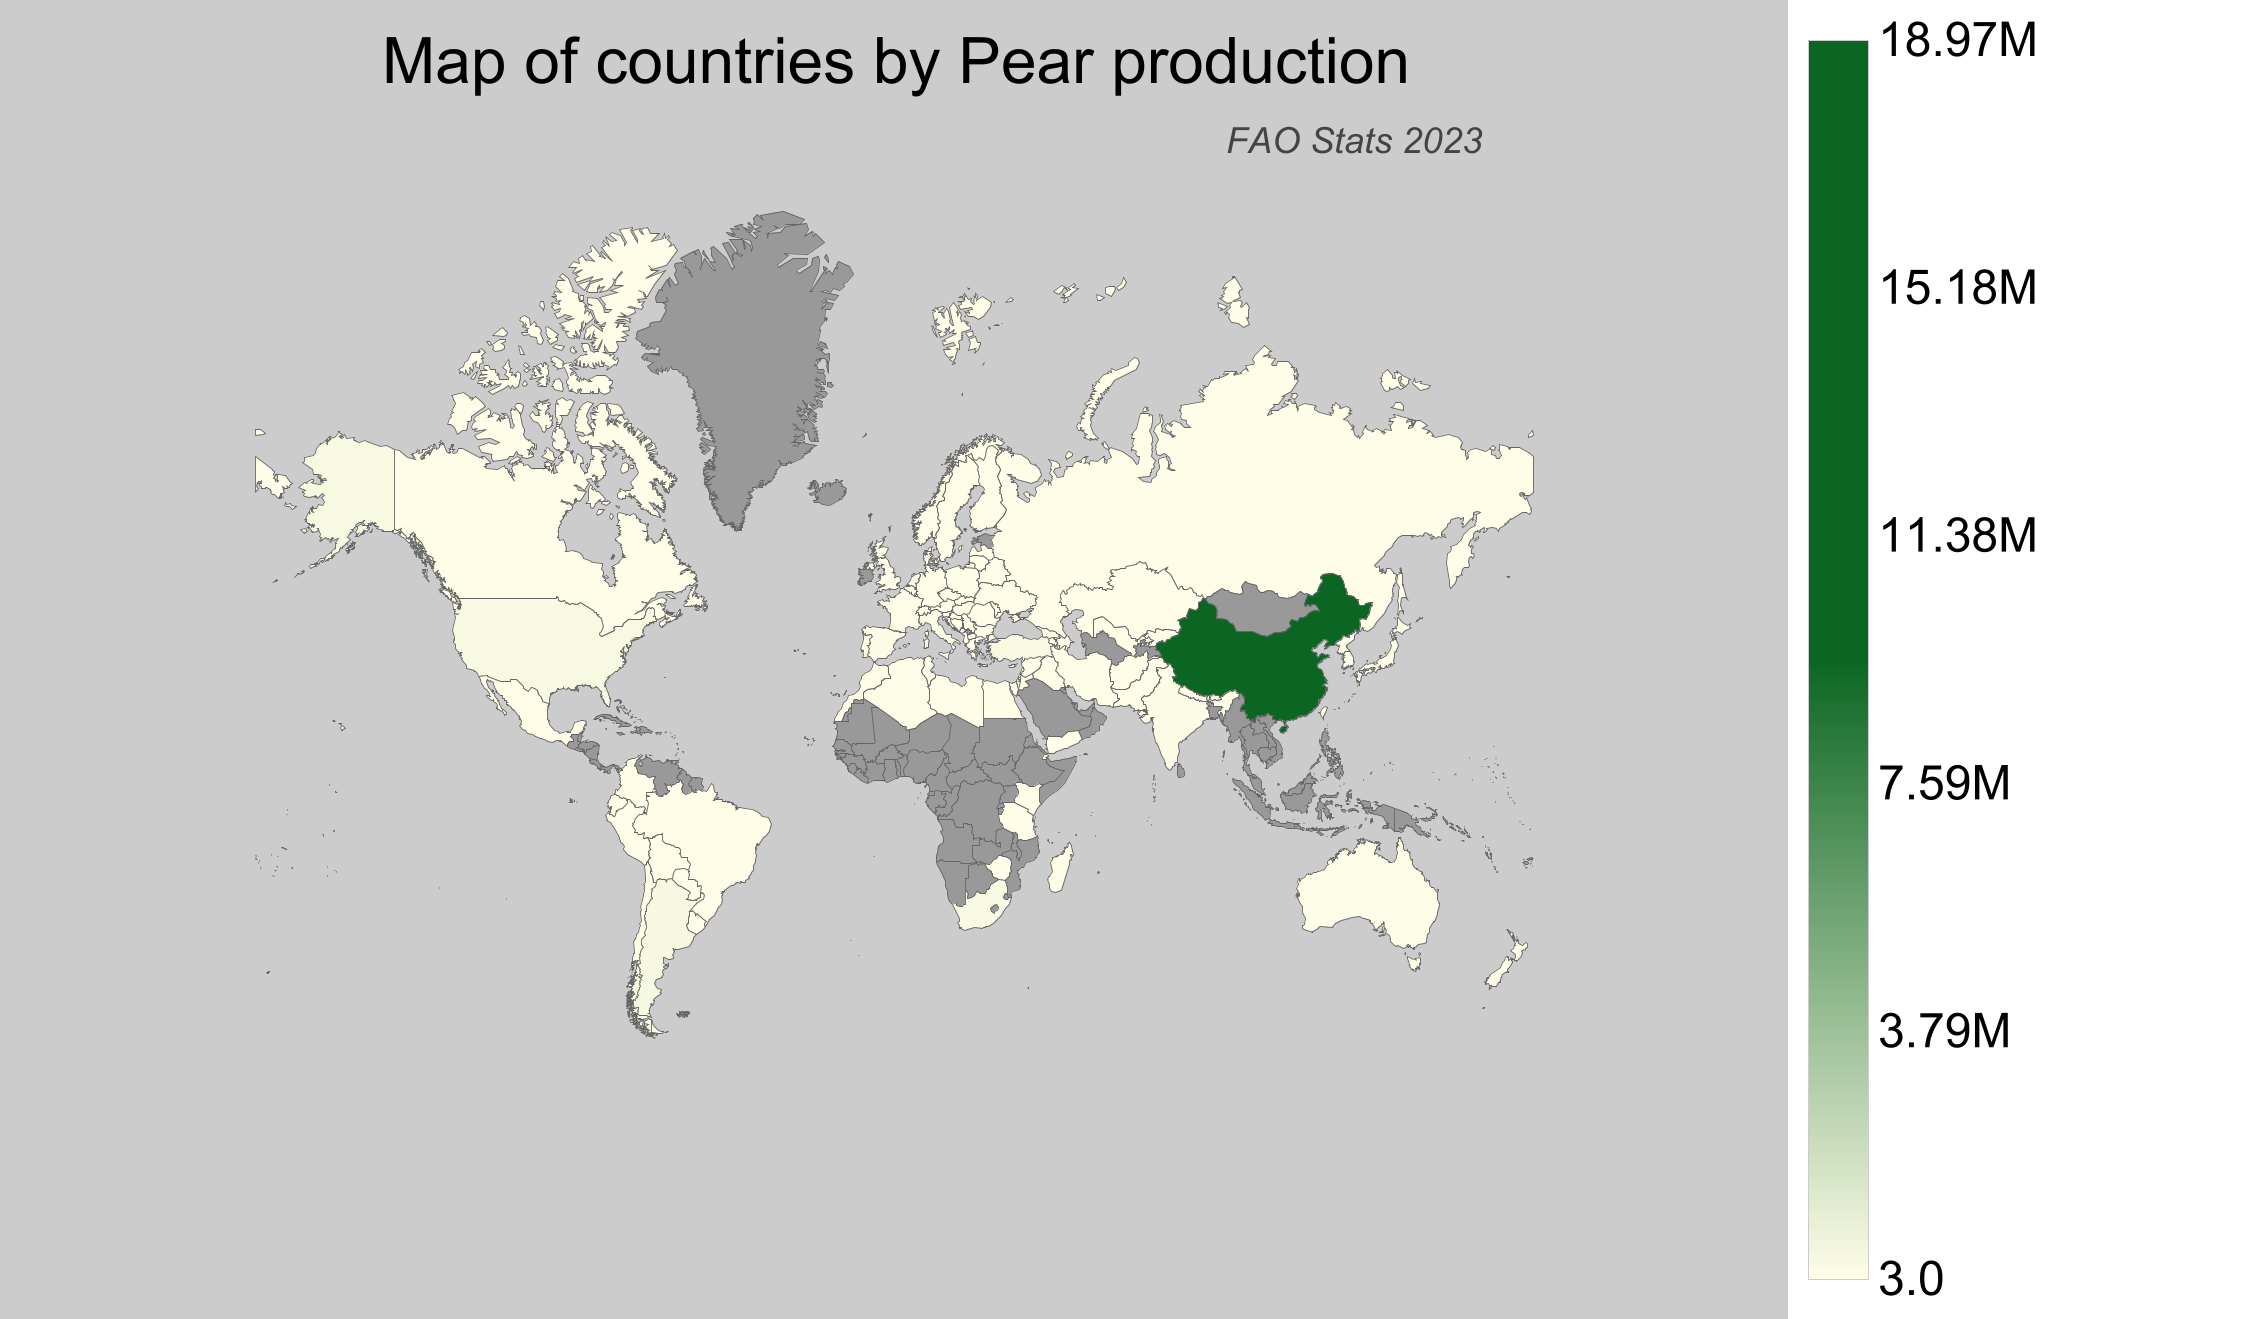
Pear Production by Country
- China dominates the global pear production with an impressive figure of about 18.98 million tonnes.
- Argentina contributes significantly with a production volume of approximately 654 thousand tonnes.
- The United States of America produces around 604 thousand tonnes, marking its place among the top countries.
- Turkey showcases a robust production of around 535 thousand tonnes.
- Canada, while not among the largest producers, still adds to the global market with a production of roughly 9 thousand tonnes.
| Country | Production (tonnes) | Production per Person (kg) | Harvested Area (ha) | Yield (kg/ha) |
|---|---|---|---|---|
 China China |
18,978,144 | 13.616 | 986,479 | 19.238 |
 Argentina Argentina |
653,838 | 14.695 | 19,526 | 33.486 |
 United States of America United States of America |
603,730 | 1.842 | 15,702 | 38.449 |
 Turkey Turkey |
534,513 | 6.261 | 22,726 | 23.52 |
 South Africa South Africa |
481,357.77 | 8.339 | 12,609 | 38.176 |
 Belgium Belgium |
381,310 | 33.399 | 10,630 | 35.871 |
 The Netherlands The Netherlands |
354,000 | 20.52 | 9,860 | 35.903 |
 Spain Spain |
288,030 | 6.173 | 18,460 | 15.603 |
 India India |
271,000 | 0.203 | 35,000 | 7.743 |
 Italy Italy |
255,700 | 4.231 | 23,030 | 11.103 |
 Chile Chile |
204,016.09 | 11.609 | 5,860 | 34.815 |
 Japan Japan |
203,100 | 1.606 | 11,200 | 18.134 |
 South Korea South Korea |
183,802 | 3.56 | 9,607 | 19.132 |
 Algeria Algeria |
170,054.71 | 3.997 | 19,281 | 8.82 |
 North Korea North Korea |
150,926.54 | 5.893 | 13,982 | 10.794 |
 Ukraine Ukraine |
144,790 | 3.426 | 10,800 | 13.406 |
 France France |
128,250 | 1.906 | 6,080 | 21.094 |
 Uzbekistan Uzbekistan |
125,074.68 | 3.83 | 7,410 | 16.879 |
 Portugal Portugal |
118,350 | 11.5 | 10,830 | 10.928 |
 Taiwan Taiwan |
102,244 | 4.337 | 4,994 | 20.473 |
 Iran Iran |
96,465.43 | 1.18 | 3,356 | 28.744 |
 Australia Australia |
92,450 | 3.691 | 5,430 | 17.026 |
 Egypt Egypt |
80,993.04 | 0.831 | 5,613 | 14.43 |
 Poland Poland |
79,000 | 2.055 | 5,600 | 14.107 |
 Russian Federation Russian Federation |
72,768.45 | 0.495 | 8,269 | 8.8 |
 Greece Greece |
62,850 | 5.837 | 4,090 | 15.367 |
 Azerbaijan Azerbaijan |
60,156.8 | 6.078 | 5,768 | 10.429 |
 Serbia Serbia |
48,027.83 | 6.86 | 5,046 | 9.518 |
 Bosnia and Herzegovina Bosnia and Herzegovina |
46,185 | 12.204 | 6,158 | 7.5 |
 Romania Romania |
41,650 | 2.133 | 3,230 | 12.895 |
 Germany Germany |
37,790 | 0.457 | 2,070 | 18.256 |
 Colombia Colombia |
37,350.06 | 0.748 | 1,711 | 21.829 |
 Morocco Morocco |
34,952.34 | 1.005 | 3,498 | 9.992 |
 Lebanon Lebanon |
32,698.64 | 5.366 | 2,771 | 11.8 |
 Belarus Belarus |
32,200 | 3.397 | 4,108 | 7.838 |
 Austria Austria |
30,570 | 3.459 | 600 | 50.95 |
 Israel Israel |
30,000 | 3.368 | 700 | 42.857 |
 Switzerland Switzerland |
28,077.95 | 3.306 | 736 | 38.149 |
 Afghanistan Afghanistan |
28,000 | 0.887 | 4,000 | 7 |
 Mexico Mexico |
26,919.14 | 0.216 | 3,598 | 7.482 |
 Nepal Nepal |
25,866.3 | 0.885 | 2,910 | 8.889 |
 Tunisia Tunisia |
22,256.11 | 1.944 | 4,666 | 4.77 |
 Syria Syria |
17,206 | 0.941 | 3,701 | 4.649 |
 New Zealand New Zealand |
16,451.95 | 3.357 | 308 | 53.415 |
 Hungary Hungary |
16,380 | 1.676 | 2,400 | 6.825 |
 Brazil Brazil |
15,681 | 0.075 | 1,019 | 15.389 |
 United Kingdom United Kingdom |
15,515 | 0.235 | 1,450 | 10.7 |
 Albania Albania |
14,762.58 | 5.143 | 811 | 18.203 |
 Kazakhstan Kazakhstan |
12,935.74 | 0.708 | 1,727 | 7.49 |
 Armenia Armenia |
12,525 | 4.217 | 2,438 | 5.137 |
 Kyrgyzstan Kyrgyzstan |
11,016.64 | 1.746 | 5,374 | 2.05 |
 Uruguay Uruguay |
10,928.02 | 3.117 | 564 | 19.376 |
 Iraq Iraq |
10,613.27 | 0.27 | 1,502 | 7.066 |
 Pakistan Pakistan |
9,614.3 | 0.048 | 1,214 | 7.92 |
 Czech Republic Czech Republic |
9,600 | 0.905 | 790 | 12.152 |
 Georgia Georgia |
9,400 | 2.52 | 2,752 | 3.416 |
 Canada Canada |
9,296 | 0.25 | 726 | 12.804 |
 Denmark Denmark |
8,060 | 1.392 | 300 | 26.867 |
 Ecuador Ecuador |
7,209.73 | 0.422 | 2,312 | 3.118 |
 Macedonia Macedonia |
6,075 | 2.927 | 3,298 | 1.842 |
 Tanzania Tanzania |
5,196.27 | 0.096 | 687 | 7.564 |
 Moldova Moldova |
5,020 | 1.414 | 2,378 | 2.111 |
 Peru Peru |
4,765.45 | 0.153 | 475 | 10.033 |
 Zimbabwe Zimbabwe |
3,244.42 | 0.218 | 509 | 6.374 |
 Bulgaria Bulgaria |
2,510 | 0.356 | 470 | 5.34 |
 Slovenia Slovenia |
2,350 | 1.137 | 210 | 11.19 |
 Sweden Sweden |
2,280 | 0.224 | 130 | 17.538 |
 Bolivia Bolivia |
1,935.91 | 0.171 | 370 | 5.232 |
 Lithuania Lithuania |
1,620 | 0.578 | 750 | 2.16 |
 Libya Libya |
1,474.09 | 0.228 | 303 | 4.865 |
 Madagascar Madagascar |
1,419.96 | 0.054 | 1,005 | 1.413 |
 Jordan Jordan |
1,357 | 0.133 | 202 | 6.718 |
 Kenya Kenya |
1,059.9 | 0.021 | 223 | 4.753 |
 Slovakia Slovakia |
1,020 | 0.187 | 110 | 9.273 |
 Yemen Yemen |
834.01 | 0.029 | 167 | 4.994 |
 Bhutan Bhutan |
670.15 | 0.922 | 94 | 7.129 |
 Croatia Croatia |
660 | 0.157 | 590 | 1.119 |
 Norway Norway |
636 | 0.12 | 67 | 9.493 |
 Saint Vincent and the Grenadines Saint Vincent and the Grenadines |
595.57 | 5.436 | 56 | 10.635 |
 Cyprus Cyprus |
460 | 0.538 | 70 | 6.571 |
 Montenegro Montenegro |
294.33 | 0.473 | 51 | 5.771 |
 Paraguay Paraguay |
214.99 | 0.03 | 33 | 6.515 |
 Latvia Latvia |
200 | 0.104 | 200 | 1 |
 Finland Finland |
150 | 0.027 | 30 | 5 |
 Palestinian Territories Palestinian Territories |
126.94 | 0.028 | 30 | 4.231 |
 Luxembourg Luxembourg |
100 | 0.166 | 10 | 10 |
 Malta Malta |
22 | 0.046 | 1 | 22 |
 Djibouti Djibouti |
3 | 0.003 | 0 | ∞ |
Top Pear Producing Countries by Share
- China alone accounts for roughly 71.6% of the world's pear production, underscoring its dominant role.
- Argentina contributes about 2.47% to the global pear industry, showcasing its competitive presence.
- The United States of America holds a share of approximately 2.28% in the global market.
- Turkey's share is about 2.02%, reflecting its consistent production figures.
- Overall, the collective share of these leading countries, led by China, makes up a significant portion of the global output.