Countries by Apple production
Apples are a vital fruit crop grown in temperate climates, contributing to nutrition and economies around the world. From sunny valleys to mountainous regions, apples thrive under diverse conditions, making them a staple in many diets. The latest data for 2023, sourced from the Food and Agriculture Organization (FAO) stats database, provides insights into global apple production trends.
Global Apple Production
In 2023, the global production of apples reached approximately 97 million tonnes. The trend over the years has shown consistent growth, with production increasing significantly from around 17 million tonnes in 1961 to the current levels. Major surges in production, particularly in the late 20th and early 21st centuries, have been notable, driven by technological advancements and expanded cultivation in leading producer countries.
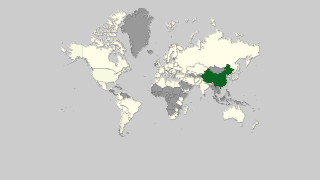
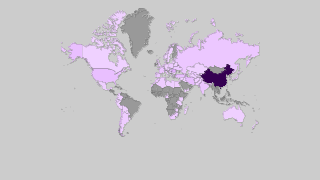
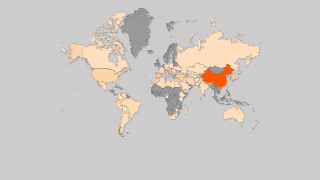
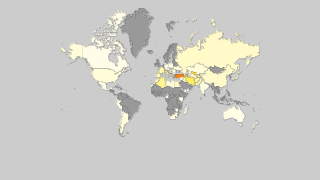
Apple Production by Country
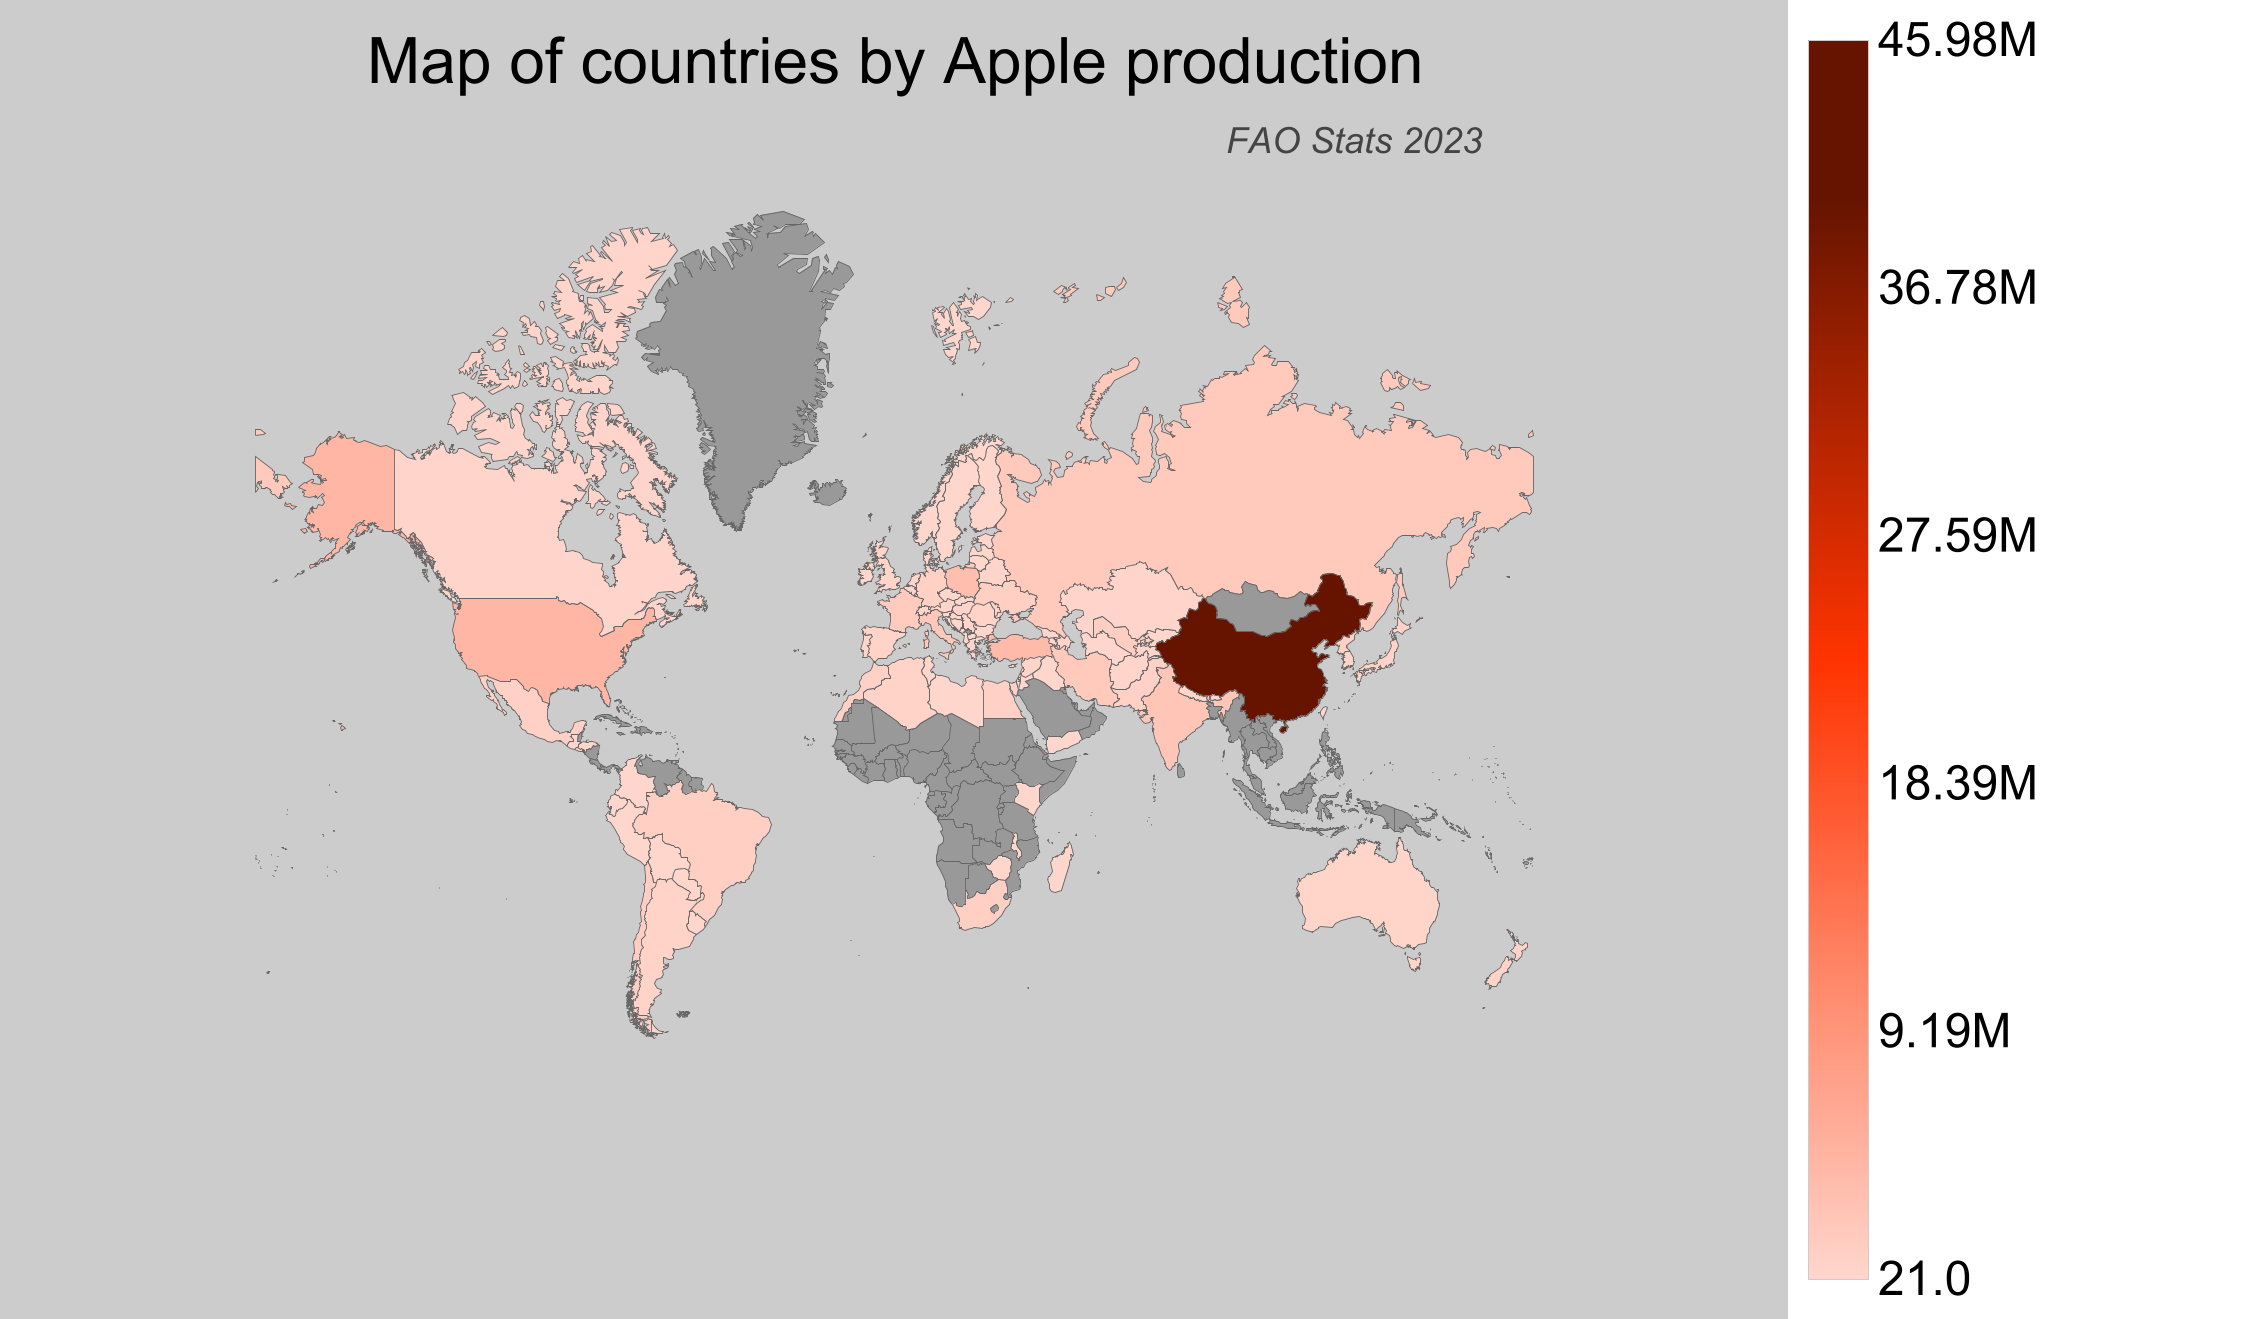
- China leads the world with a staggering apple production volume of around 46 million tonnes.
- The United States of America follows, producing approximately 5.2 million tonnes of apples.
- Turkey contributes significantly with over 4.6 million tonnes.
- Poland, another major player, produces close to 3.9 million tonnes of apples.
- Canada, while not among the top producers, adds to the global production with over 368,000 tonnes of apples, according to FAO stats.
| Country | Production (tonnes) | Production per Person (kg) | Harvested Area (ha) | Yield (kg/ha) |
|---|---|---|---|---|
 China China |
45,984,858 | 32.991 | 2,092,512 | 21.976 |
 United States of America United States of America |
5,151,680 | 15.718 | 120,233 | 42.847 |
 Turkey Turkey |
4,602,517 | 53.911 | 167,437 | 27.488 |
 Poland Poland |
3,892,700 | 101.284 | 150,000 | 25.951 |
 India India |
2,876,000 | 2.152 | 304,000 | 9.461 |
 Italy Italy |
2,267,750 | 37.523 | 54,080 | 41.933 |
 Iran Iran |
2,177,336.96 | 26.632 | 106,345 | 20.474 |
 Russian Federation Russian Federation |
2,083,191.29 | 14.183 | 201,388 | 10.344 |
 France France |
1,894,440 | 28.15 | 53,800 | 35.213 |
 Chile Chile |
1,475,949.64 | 83.985 | 29,006 | 50.884 |
 Uzbekistan Uzbekistan |
1,385,872.23 | 42.441 | 120,507 | 11.5 |
 South Africa South Africa |
1,198,897.39 | 20.769 | 28,134 | 42.614 |
 Brazil Brazil |
1,183,794 | 5.65 | 33,358 | 35.488 |
 Ukraine Ukraine |
1,172,750 | 27.748 | 75,600 | 15.513 |
 Germany Germany |
941,210 | 11.375 | 33,110 | 28.427 |
 Egypt Egypt |
892,140.48 | 9.15 | 34,804 | 25.633 |
 Morocco Morocco |
860,348.52 | 24.741 | 47,009 | 18.302 |
 Pakistan Pakistan |
821,605.51 | 4.07 | 75,580 | 10.871 |
 Mexico Mexico |
814,533.51 | 6.53 | 54,551 | 14.932 |
 North Korea North Korea |
811,059.98 | 31.669 | 69,615 | 11.651 |
 Japan Japan |
603,800 | 4.773 | 34,600 | 17.451 |
 New Zealand New Zealand |
586,125.21 | 119.59 | 9,811 | 59.742 |
 Algeria Algeria |
575,880.85 | 13.535 | 32,149 | 17.913 |
 Romania Romania |
534,140 | 27.358 | 54,290 | 9.839 |
 Argentina Argentina |
528,749 | 11.883 | 19,463 | 27.167 |
 Spain Spain |
527,680 | 11.309 | 28,410 | 18.574 |
 Moldova Moldova |
517,613 | 145.77 | 43,054 | 12.022 |
 Hungary Hungary |
486,300 | 49.77 | 22,790 | 21.338 |
 United Kingdom United Kingdom |
407,769.78 | 6.175 | 14,400 | 28.317 |
 South Korea South Korea |
394,428 | 7.639 | 33,789 | 11.673 |
 Serbia Serbia |
379,690 | 54.23 | 27,412 | 13.851 |
 Canada Canada |
368,476 | 9.902 | 15,363 | 23.985 |
 Belarus Belarus |
336,700 | 35.524 | 34,218 | 9.84 |
 Afghanistan Afghanistan |
324,000 | 10.261 | 31,000 | 10.452 |
 Azerbaijan Azerbaijan |
301,786.5 | 30.489 | 26,360 | 11.449 |
 Portugal Portugal |
292,230 | 28.397 | 13,940 | 20.963 |
 Australia Australia |
285,176 | 11.385 | 17,982 | 15.859 |
 Kazakhstan Kazakhstan |
251,475 | 13.763 | 32,553 | 7.725 |
 Greece Greece |
242,710 | 22.54 | 9,750 | 24.893 |
 Tajikistan Tajikistan |
238,105.96 | 26.661 | 45,716 | 5.208 |
 Lebanon Lebanon |
235,335.67 | 38.621 | 13,791 | 17.064 |
 Syria Syria |
220,646 | 12.067 | 51,069 | 4.321 |
 Belgium Belgium |
203,010 | 17.782 | 4,900 | 41.431 |
 The Netherlands The Netherlands |
198,000 | 11.477 | 5,500 | 36 |
 Austria Austria |
191,910 | 21.714 | 6,250 | 30.706 |
 Bosnia and Herzegovina Bosnia and Herzegovina |
190,263 | 50.275 | 14,818 | 12.84 |
 Switzerland Switzerland |
171,249.88 | 20.164 | 3,648 | 46.943 |
 Kyrgyzstan Kyrgyzstan |
139,436.68 | 22.1 | 27,367 | 5.095 |
 Tunisia Tunisia |
133,363.28 | 11.651 | 23,825 | 5.598 |
 Peru Peru |
125,537.15 | 4.019 | 7,248 | 17.32 |
 Czech Republic Czech Republic |
101,020 | 9.518 | 6,450 | 15.662 |
 Albania Albania |
97,273.87 | 33.89 | 4,365 | 22.285 |
 Armenia Armenia |
94,825.2 | 31.93 | 10,457 | 9.068 |
 Israel Israel |
92,000 | 10.328 | 2,573 | 35.756 |
 Macedonia Macedonia |
80,283 | 38.685 | 9,646 | 8.323 |
 Iraq Iraq |
75,660.46 | 1.923 | 24,615 | 3.074 |
 Turkmenistan Turkmenistan |
65,392.55 | 11.175 | 5,936 | 11.016 |
 Croatia Croatia |
61,530 | 14.678 | 3,650 | 16.858 |
 Nepal Nepal |
52,783.82 | 1.806 | 6,199 | 8.515 |
 Georgia Georgia |
50,400 | 13.514 | 28,907 | 1.744 |
 Uruguay Uruguay |
48,023.32 | 13.698 | 2,339 | 20.532 |
 El Salvador El Salvador |
44,610.07 | 6.715 | 6,692 | 6.666 |
 Lithuania Lithuania |
38,420 | 13.718 | 9,030 | 4.255 |
 Bulgaria Bulgaria |
34,930 | 4.955 | 3,560 | 9.812 |
 Sweden Sweden |
32,170 | 3.163 | 1,450 | 22.186 |
 Slovenia Slovenia |
30,600 | 14.805 | 2,000 | 15.3 |
 Yemen Yemen |
30,069.2 | 1.04 | 2,459 | 12.228 |
 Slovakia Slovakia |
26,400 | 4.85 | 1,540 | 17.143 |
 Guatemala Guatemala |
25,571.27 | 1.478 | 6,061 | 4.219 |
 Denmark Denmark |
24,450 | 4.223 | 1,450 | 16.862 |
 Ireland Ireland |
21,990 | 4.527 | 710 | 30.972 |
 Norway Norway |
20,104 | 3.784 | 1,648 | 12.199 |
 Jordan Jordan |
16,072 | 1.571 | 845 | 19.02 |
 Colombia Colombia |
13,148.2 | 0.263 | 445 | 29.547 |
 Libya Libya |
9,000.88 | 1.391 | 210 | 42.861 |
 Finland Finland |
7,800 | 1.414 | 660 | 11.818 |
 Latvia Latvia |
7,700 | 3.999 | 3,300 | 2.333 |
 Ecuador Ecuador |
7,188.5 | 0.421 | 1,356 | 5.301 |
 Madagascar Madagascar |
7,166.77 | 0.273 | 4,665 | 1.536 |
 Zimbabwe Zimbabwe |
4,964.15 | 0.334 | 217 | 22.876 |
 Malawi Malawi |
3,161.7 | 0.176 | 777 | 4.069 |
 Cyprus Cyprus |
2,900 | 3.393 | 400 | 7.25 |
 Bolivia Bolivia |
2,748.99 | 0.243 | 724 | 3.797 |
 Bhutan Bhutan |
2,317.09 | 3.187 | 453 | 5.115 |
 Saint Vincent and the Grenadines Saint Vincent and the Grenadines |
1,652.84 | 15.087 | 55 | 30.052 |
 Montenegro Montenegro |
1,504.14 | 2.417 | 259 | 5.807 |
 Taiwan Taiwan |
1,458 | 0.062 | 186 | 7.839 |
 Estonia Estonia |
990 | 0.75 | 750 | 1.32 |
 Luxembourg Luxembourg |
990 | 1.645 | 100 | 9.9 |
 Palestinian Territories Palestinian Territories |
971.37 | 0.213 | 120 | 8.095 |
 Kenya Kenya |
788.86 | 0.015 | 274 | 2.879 |
 Paraguay Paraguay |
674.24 | 0.096 | 84 | 8.027 |
 Grenada Grenada |
472.92 | 4.577 | 108 | 4.379 |
 Honduras Honduras |
195.89 | 0.022 | 91 | 2.153 |
 Malta Malta |
21 | 0.044 | 6 | 3.5 |
Top Apple Producing Countries by Share
- China accounts for an impressive 47% of the global apple production, highlighting its dominance in the apple market.
- The United States holds a significant share of about 5.3% of the world's apple production.
- Turkey, with a share of approximately 4.7%, is a key contributor to the global apple landscape.
- Poland's production represents around 4% of the global total.
- Despite being a smaller player, Canada's apple production represents roughly 0.38% of the worldwide total, showcasing its regional importance.