Countries by Plum production
Plums are a popular fruit worldwide, known for their sweet flavor and nutritional benefits. They thrive in temperate climates, often in regions with warm summers and cool winters. This comprehensive overview focuses on the latest plum production data for 2023, sourced from the Food and Agriculture Organization (FAO) stats database, providing insights into global production trends and regional highlights.

Global Plum Production
In 2023, global plum production reached approximately 12.49 million tonnes, showing a significant increase from around 6.18 million tonnes in 1961. Over the years, production has generally trended upwards, with substantial growth seen especially from 1996 onwards. The increase from 1961 to 2023 highlights the fruit's growing importance and demand in the global market.
Plum Production by Country
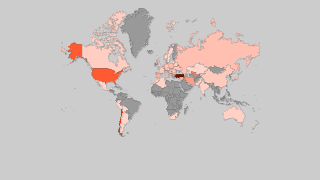
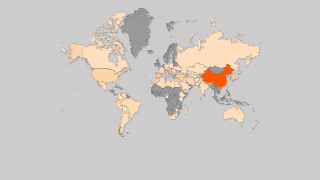
- China remains the top producer with approximately 6.63 million tonnes, emphasizing its major role in the global plum market.
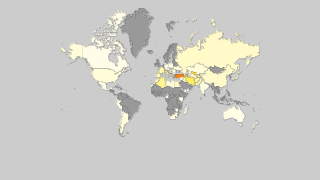
- Romania follows with a production of 645,090 tonnes, showcasing a strong European presence in plum production.
- Chile produced 433,935 tonnes, highlighting its importance in South American agriculture.
- Serbia contributed with 362,713 tonnes, further solidifying its position as a significant producer in Europe.
- Canada, while not among the top producers, recorded a production of approximately 3,869 tonnes, reflecting its role within North American agriculture.
| Country | Production (tonnes) | Production per Person (kg) | Harvested Area (ha) | Yield (kg/ha) |
|---|---|---|---|---|
 China China |
6,626,317.1 | 4.754 | 1,946,505 | 3.404 |
 Romania Romania |
645,090 | 33.041 | 67,740 | 9.523 |
 Chile Chile |
433,934.8 | 24.692 | 15,995 | 27.129 |
 Serbia Serbia |
362,713.33 | 51.806 | 74,418 | 4.874 |
 Turkey Turkey |
355,132 | 4.16 | 21,342 | 16.64 |
 Iran Iran |
354,789.11 | 4.34 | 16,008 | 22.163 |
 United States of America United States of America |
342,000 | 1.043 | 18,940 | 18.057 |
 Bosnia and Herzegovina Bosnia and Herzegovina |
269,619 | 71.245 | 36,633 | 7.36 |
 India India |
232,480.65 | 0.174 | 27,921 | 8.326 |
 France France |
207,580 | 3.085 | 15,110 | 13.738 |
 Russian Federation Russian Federation |
189,195.39 | 1.288 | 43,171 | 4.382 |
 Uzbekistan Uzbekistan |
178,191.18 | 5.457 | 15,127 | 11.78 |
 Morocco Morocco |
175,739.41 | 5.054 | 16,582 | 10.598 |
 Ukraine Ukraine |
165,310 | 3.911 | 16,100 | 10.268 |
 Spain Spain |
162,940 | 3.492 | 12,640 | 12.891 |
 Italy Italy |
160,960 | 2.663 | 11,920 | 13.503 |
 Moldova Moldova |
150,341 | 42.339 | 19,033 | 7.899 |
 Poland Poland |
127,100 | 3.307 | 16,900 | 7.521 |
 Algeria Algeria |
98,278.19 | 2.31 | 11,495 | 8.55 |
 Argentina Argentina |
97,117.65 | 2.183 | 15,577 | 6.235 |
 South Africa South Africa |
94,288 | 1.633 | 11,802 | 7.989 |
 Pakistan Pakistan |
81,429.63 | 0.403 | 5,470 | 14.887 |
 Mexico Mexico |
64,894.5 | 0.52 | 11,346 | 5.72 |
 Bulgaria Bulgaria |
57,740 | 8.19 | 9,260 | 6.235 |
 Libya Libya |
55,550.52 | 8.585 | 10,524 | 5.278 |
 South Korea South Korea |
54,677.51 | 1.059 | 7,412 | 7.377 |
 Germany Germany |
49,630 | 0.6 | 4,770 | 10.405 |
 Afghanistan Afghanistan |
47,041.32 | 1.49 | 5,449 | 8.633 |
 Azerbaijan Azerbaijan |
43,712.9 | 4.416 | 4,813 | 9.082 |
 Albania Albania |
39,837.26 | 13.879 | 2,681 | 14.859 |
 Egypt Egypt |
39,522.41 | 0.405 | 3,164 | 12.491 |
 Hungary Hungary |
37,370 | 3.825 | 6,930 | 5.392 |
 Lebanon Lebanon |
37,288.87 | 6.119 | 3,004 | 12.413 |
 Turkmenistan Turkmenistan |
34,040.4 | 5.817 | 1,817 | 18.734 |
 Armenia Armenia |
29,825.5 | 10.043 | 2,944 | 10.131 |
 Australia Australia |
24,045 | 0.96 | 4,306 | 5.584 |
 Syria Syria |
22,026 | 1.205 | 3,625 | 6.076 |
 Macedonia Macedonia |
21,313 | 10.27 | 5,988 | 3.559 |
 Greece Greece |
21,200 | 1.969 | 2,030 | 10.443 |
 Tunisia Tunisia |
20,938.93 | 1.829 | 3,522 | 5.945 |
 Colombia Colombia |
19,874.99 | 0.398 | 1,371 | 14.497 |
 Portugal Portugal |
18,670 | 1.814 | 1,630 | 11.454 |
 Japan Japan |
17,100 | 0.135 | 2,590 | 6.602 |
 Yemen Yemen |
16,622.61 | 0.575 | 2,861 | 5.81 |
 Israel Israel |
16,500 | 1.852 | 891 | 18.519 |
 Georgia Georgia |
12,600 | 3.378 | 4,375 | 2.88 |
 Kyrgyzstan Kyrgyzstan |
12,329.75 | 1.954 | 1,932 | 6.382 |
 Taiwan Taiwan |
10,848 | 0.46 | 1,373 | 7.901 |
 Belarus Belarus |
10,843.52 | 1.144 | 8,411 | 1.289 |
 Iraq Iraq |
9,081.12 | 0.231 | 1,319 | 6.885 |
 Ecuador Ecuador |
8,744.17 | 0.512 | 1,145 | 7.637 |
 Nepal Nepal |
7,875.78 | 0.27 | 1,276 | 6.172 |
 Kazakhstan Kazakhstan |
7,861.34 | 0.43 | 1,792 | 4.387 |
 Jordan Jordan |
7,052 | 0.689 | 293 | 24.068 |
 The Netherlands The Netherlands |
6,430 | 0.373 | 260 | 24.731 |
 Austria Austria |
6,370 | 0.721 | 210 | 30.333 |
 Croatia Croatia |
5,620 | 1.341 | 3,870 | 1.452 |
 Czech Republic Czech Republic |
5,420 | 0.511 | 1,880 | 2.883 |
 Peru Peru |
5,145.61 | 0.165 | 964 | 5.338 |
 United Kingdom United Kingdom |
5,070 | 0.077 | 390 | 13 |
 Switzerland Switzerland |
4,525.23 | 0.533 | 311 | 14.551 |
 Tajikistan Tajikistan |
4,152.94 | 0.465 | 11,895 | 0.349 |
 Bolivia Bolivia |
4,142.87 | 0.366 | 419 | 9.888 |
 Tanzania Tanzania |
4,114.06 | 0.076 | 624 | 6.593 |
 Canada Canada |
3,869 | 0.104 | 481 | 8.044 |
 Madagascar Madagascar |
2,390.23 | 0.091 | 482 | 4.959 |
 Uruguay Uruguay |
2,164.4 | 0.617 | 210 | 10.307 |
 Norway Norway |
2,123 | 0.4 | 390 | 5.444 |
 Paraguay Paraguay |
2,021.94 | 0.287 | 321 | 6.299 |
 Cyprus Cyprus |
1,650 | 1.93 | 400 | 4.125 |
 Swaziland Swaziland |
1,434.34 | 1.237 | 258 | 5.559 |
 Palestinian Territories Palestinian Territories |
1,430.9 | 0.314 | 295 | 4.851 |
 New Zealand New Zealand |
1,302.59 | 0.266 | 278 | 4.686 |
 Slovakia Slovakia |
1,190 | 0.219 | 580 | 2.052 |
 Montenegro Montenegro |
1,116.14 | 1.793 | 372 | 3 |
 Kenya Kenya |
917.71 | 0.018 | 140 | 6.555 |
 Grenada Grenada |
755.85 | 7.315 | 219 | 3.451 |
 Lithuania Lithuania |
650 | 0.232 | 540 | 1.204 |
 Cameroon Cameroon |
620.97 | 0.026 | 125 | 4.968 |
 Denmark Denmark |
480 | 0.083 | 100 | 4.8 |
 Belgium Belgium |
380 | 0.033 | 60 | 6.333 |
 Luxembourg Luxembourg |
300 | 0.498 | 30 | 10 |
 Bhutan Bhutan |
274.54 | 0.378 | 36 | 7.626 |
 Zimbabwe Zimbabwe |
270.41 | 0.018 | 86 | 3.144 |
 Slovenia Slovenia |
270 | 0.131 | 70 | 3.857 |
 Sweden Sweden |
220 | 0.022 | 40 | 5.5 |
 Malawi Malawi |
149.14 | 0.008 | 24 | 6.214 |
 Latvia Latvia |
100 | 0.052 | 100 | 1 |
 Estonia Estonia |
20 | 0.015 | 20 | 1 |
Top Plum Producing Countries by Share
- China alone accounts for 53.05% of global plum production, illustrating its dominant position in the industry.
- Romania holds a 5.16% share of the global production, underscoring its regional significance.
- Chile and Serbia contribute 3.47% and 2.90% respectively, showcasing their importance as producers.
- The combined output of these countries reflects a substantial portion of the global market, with China’s share being particularly noteworthy due to its size.