Countries by Cherry production
Cherries are not just a delicious fruit enjoyed worldwide; they play a significant role in agricultural economies and dietary health. These vibrant fruits thrive in temperate climates, often found in regions with hot summers and cold winters. According to the latest available data from the Food and Agriculture Organization (FAO) stats database in 2025, cherry production has seen impressive growth, capturing the attention of global agriculture stakeholders.
Global Cherry Production
In 2023, the global cherry production reached around 2.96 million tonnes, marking an upward trend from approximately 1.30 million tonnes in 1961. This growth highlights the increasing global demand and expansion in cherry cultivation. Over the decades, notable increments occurred, particularly a 38% rise from 2021 to 2023, reflecting advancements in agricultural techniques and expansion of cherry-growing regions.
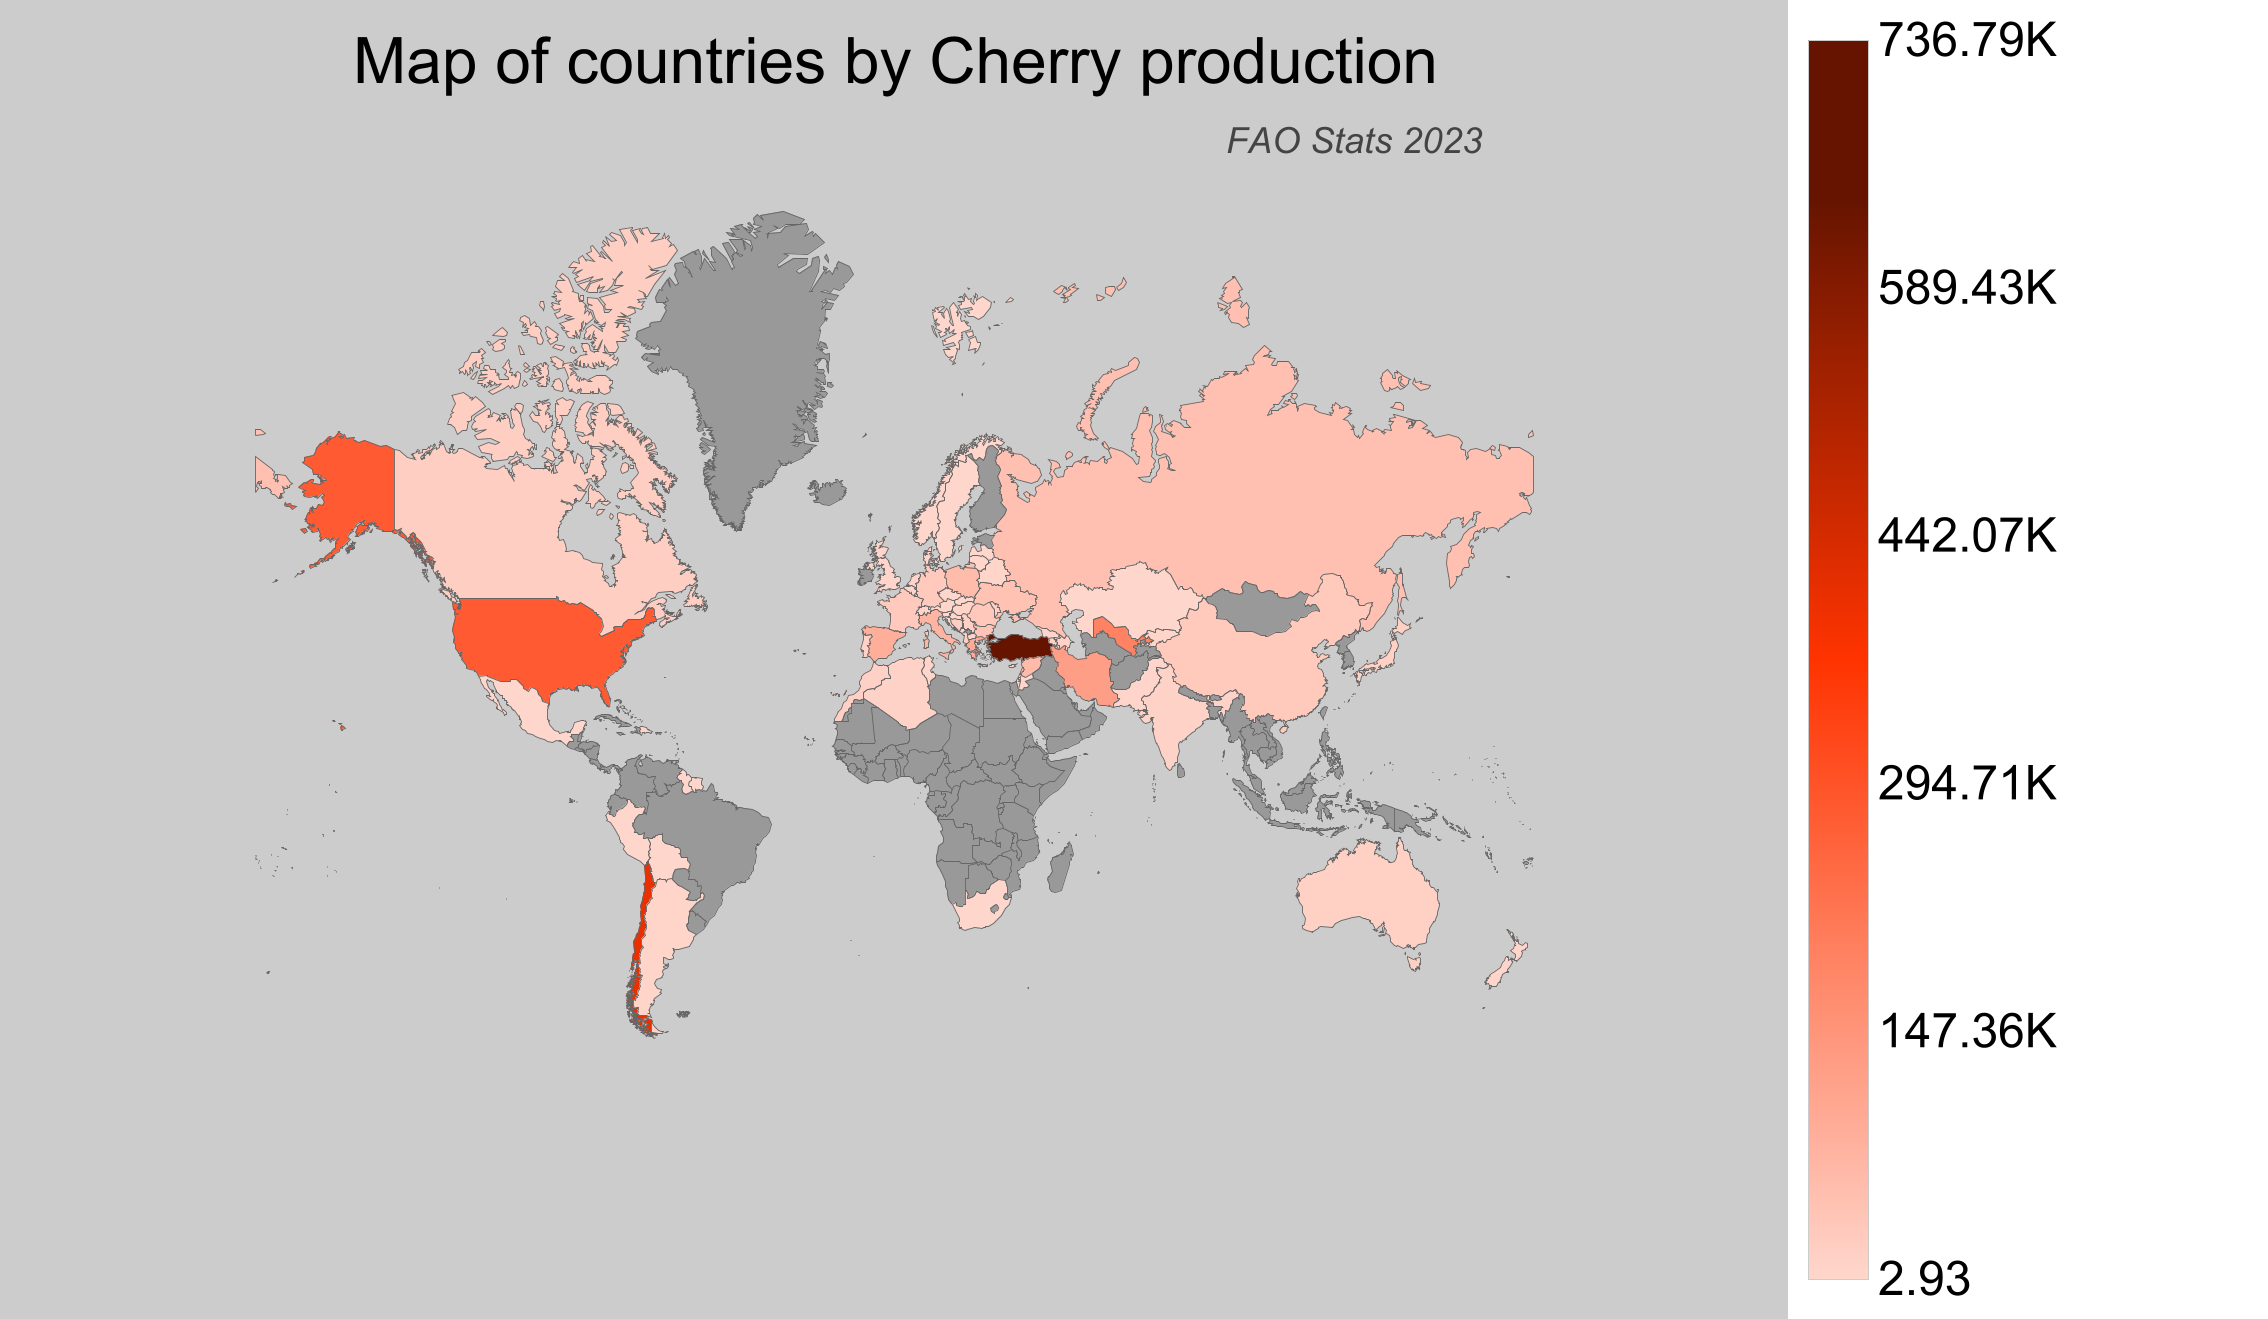
Cherry Production by Country
- Turkey leads the world in cherry production with approximately 737,000 tonnes, securing its position as a top producer.
- Chile follows with a considerable production volume of around 465,000 tonnes, showcasing its burgeoning cherry industry.
- The United States of America maintains a strong presence, producing about 321,000 tonnes of cherries.
- Uzbekistan contributes approximately 219,000 tonnes, reflecting its growing involvement in global cherry markets.
- Canada, while not among the top global producers, produces around 22,350 tonnes, demonstrating its niche contribution to cherry production.
| Country | Production (tonnes) | Production per Person (kg) | Harvested Area (ha) | Yield (kg/ha) |
|---|---|---|---|---|
 Turkey Turkey |
736,791 | 8.63 | 79,862 | 9.226 |
 Chile Chile |
465,348.22 | 26.479 | 63,495 | 7.329 |
 United States of America United States of America |
321,420 | 0.981 | 35,208 | 9.129 |
 Uzbekistan Uzbekistan |
218,866.75 | 6.703 | 16,440 | 13.313 |
 Iran Iran |
144,876.58 | 1.772 | 20,459 | 7.081 |
 Greece Greece |
113,580 | 10.548 | 16,460 | 6.9 |
 Spain Spain |
104,470 | 2.239 | 28,340 | 3.686 |
 Italy Italy |
87,710 | 1.451 | 28,360 | 3.093 |
 Syria Syria |
72,694 | 3.976 | 31,005 | 2.345 |
 Poland Poland |
68,800 | 1.79 | 9,600 | 7.167 |
 Russian Federation Russian Federation |
56,568.73 | 0.385 | 11,299 | 5.007 |
 Ukraine Ukraine |
53,230 | 1.259 | 6,400 | 8.317 |
 Bulgaria Bulgaria |
46,230 | 6.557 | 9,650 | 4.791 |
 Romania Romania |
36,560 | 1.873 | 3,860 | 9.472 |
 China China |
35,746.49 | 0.026 | 8,558 | 4.177 |
 Germany Germany |
32,350 | 0.391 | 5,690 | 5.685 |
 Lebanon Lebanon |
31,233.78 | 5.126 | 3,277 | 9.531 |
 France France |
31,080 | 0.462 | 6,680 | 4.653 |
 Canada Canada |
22,350 | 0.601 | 2,291 | 9.756 |
 Bosnia and Herzegovina Bosnia and Herzegovina |
21,382 | 5.65 | 3,341 | 6.4 |
 Albania Albania |
19,695.6 | 6.862 | 2,315 | 8.508 |
 Japan Japan |
17,300 | 0.137 | 4,200 | 4.119 |
 Moldova Moldova |
16,051 | 4.52 | 4,679 | 3.43 |
 Serbia Serbia |
15,575.72 | 2.225 | 4,435 | 3.512 |
 Australia Australia |
15,114 | 0.603 | 2,106 | 7.177 |
 Morocco Morocco |
14,144.76 | 0.407 | 3,064 | 4.616 |
 Armenia Armenia |
12,010.8 | 4.044 | 1,786 | 6.725 |
 Portugal Portugal |
11,810 | 1.148 | 6,470 | 1.825 |
 Algeria Algeria |
11,584.51 | 0.272 | 3,875 | 2.99 |
 Azerbaijan Azerbaijan |
10,910.4 | 1.102 | 2,013 | 5.42 |
 India India |
10,682.6 | 0.008 | 3,576 | 2.987 |
 Dominican Republic Dominican Republic |
9,199 | 0.896 | 2,338 | 3.935 |
 Hungary Hungary |
9,110 | 0.932 | 2,960 | 3.078 |
 The Netherlands The Netherlands |
8,220 | 0.476 | 550 | 14.945 |
 Belgium Belgium |
7,500 | 0.657 | 940 | 7.979 |
 Argentina Argentina |
7,486.31 | 0.168 | 2,203 | 3.398 |
 Georgia Georgia |
5,800 | 1.555 | 1,893 | 3.064 |
 Belarus Belarus |
4,752.66 | 0.501 | 506 | 9.393 |
 Israel Israel |
4,603 | 0.517 | 546 | 8.43 |
 Kyrgyzstan Kyrgyzstan |
4,597.46 | 0.729 | 1,078 | 4.265 |
 Austria Austria |
4,480 | 0.507 | 270 | 16.593 |
 Switzerland Switzerland |
4,464.33 | 0.526 | 523 | 8.536 |
 Tunisia Tunisia |
4,431.08 | 0.387 | 1,027 | 4.315 |
 Macedonia Macedonia |
3,928 | 1.893 | 10,639 | 0.369 |
 United Kingdom United Kingdom |
3,926.77 | 0.059 | 759 | 5.174 |
 New Zealand New Zealand |
3,589.31 | 0.732 | 1,191 | 3.014 |
 Pakistan Pakistan |
2,875.87 | 0.014 | 924 | 3.112 |
 Jordan Jordan |
2,453 | 0.24 | 144 | 17.035 |
 Guyana Guyana |
2,404.11 | 3.073 | 43 | 55.91 |
 Montenegro Montenegro |
2,097.52 | 3.37 | 727 | 2.885 |
 Suriname Suriname |
1,983.99 | 3.491 | 73 | 27.178 |
 South Africa South Africa |
1,796.86 | 0.031 | 1,057 | 1.7 |
 Czech Republic Czech Republic |
1,490 | 0.14 | 840 | 1.774 |
 Palestinian Territories Palestinian Territories |
1,253.25 | 0.275 | 194 | 6.46 |
 Norway Norway |
1,117 | 0.21 | 178 | 6.275 |
 Bolivia Bolivia |
897 | 0.079 | 418 | 2.146 |
 Croatia Croatia |
800 | 0.191 | 880 | 0.909 |
 Denmark Denmark |
690 | 0.119 | 170 | 4.059 |
 Slovakia Slovakia |
680 | 0.125 | 160 | 4.25 |
 Slovenia Slovenia |
580 | 0.281 | 220 | 2.636 |
 Cyprus Cyprus |
391 | 0.457 | 230 | 1.7 |
 Kazakhstan Kazakhstan |
284.09 | 0.016 | 432 | 0.658 |
 Mexico Mexico |
129.76 | 0.001 | 38 | 3.415 |
 Sweden Sweden |
92 | 0.009 | 311 | 0.296 |
 Latvia Latvia |
53 | 0.028 | 124 | 0.427 |
 Luxembourg Luxembourg |
20 | 0.033 | 0 | ∞ |
 Lithuania Lithuania |
10 | 0.004 | 30 | 0.333 |
 Peru Peru |
2.93 | 0 | 1 | 2.93 |
Top Cherry Producing Countries by Share
- Turkey dominates the global cherry market with nearly 25% of total production, highlighting its leading role.
- Chile's share stands at around 15.7%, cementing its status as a significant player in cherry exports.
- With approximately 10.8% of global production, the United States remains a key contributor to the cherry supply chain.
- Uzbekistan, with a 7.4% share, showcases the diversity of cherry production across the globe.
- Canada, representing about 0.75% of total production, provides high-quality cherries despite its smaller market share.