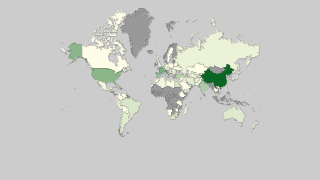
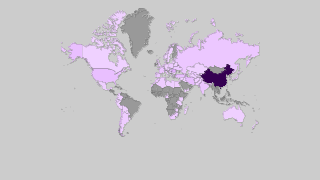
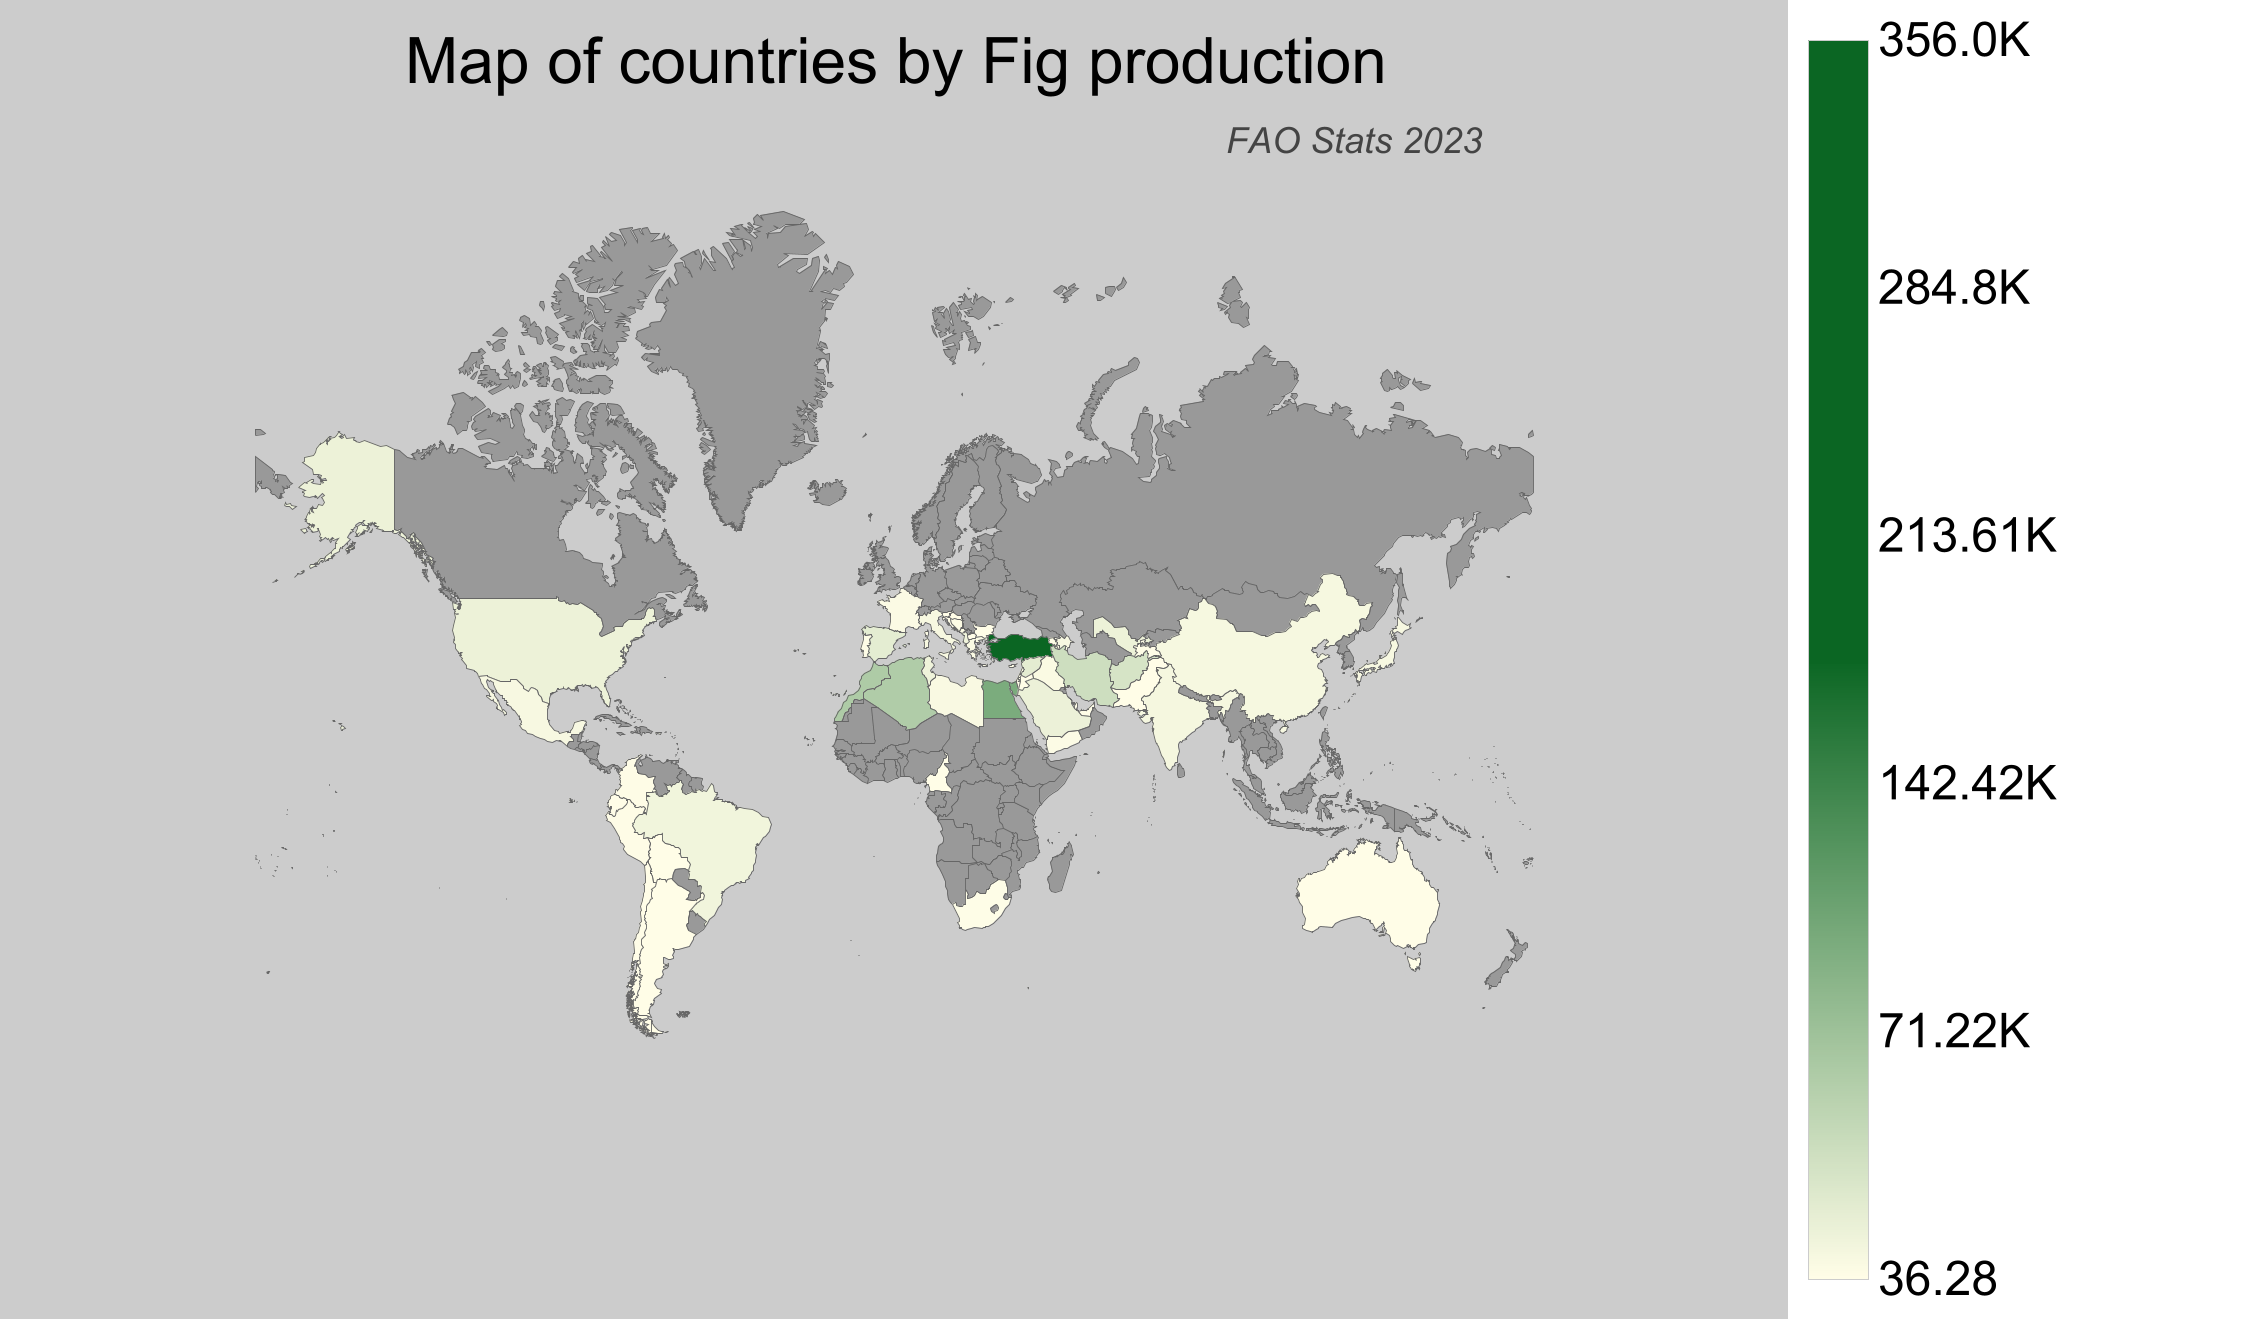
Countries by Fig production
Figs are a vital part of global agriculture due to their nutritional benefits and versatile use in various culinary dishes. Figs thrive in warm climates, typically in Mediterranean and similar regions. The data presented here for the year 2023 is the latest available from the Food and Agriculture Organization (FAO) stats database, accessed in 2025.
Global Fig Production
In 2023, the global production of figs reached around 1.3 million tonnes. Over the years, fig production has shown resilience with a slight upward trend, rising from approximately 1.57 million tonnes in 1961 to 1.3 million tonnes in recent years. A significant change was observed in the mid-2000s, reflecting overall growth and increased demand for this nutritious fruit.
Fig Production by Country
- Turkey is a leading producer with around 356,000 tonnes of figs produced, highlighting its pivotal role in this sector.
- Egypt follows with a substantial production nearing 193,000 tonnes, showcasing its strategic agricultural capacity.
- Morocco contributes significantly as well, producing around 119,000 tonnes of figs.
- Algeria also plays a vital role, yielding about 116,000 tonnes of figs.
- According to FAO statistics, Canada does not produce figs, highlighting different agricultural focuses due to its climate.
| Country | Production (tonnes) | Production per Person (kg) | Harvested Area (ha) | Yield (kg/ha) |
|---|---|---|---|---|
 Turkey Turkey |
356,000 | 4.17 | 57,459 | 6.196 |
 Egypt Egypt |
193,057.96 | 1.98 | 28,667 | 6.735 |
 Morocco Morocco |
119,166.59 | 3.427 | 69,737 | 1.709 |
 Algeria Algeria |
116,183.18 | 2.731 | 38,374 | 3.028 |
 Iran Iran |
73,483.39 | 0.899 | 12,206 | 6.02 |
 Afghanistan Afghanistan |
60,651.09 | 1.921 | 10,228 | 5.93 |
 Syria Syria |
40,760 | 2.229 | 9,645 | 4.226 |
 Spain Spain |
39,650 | 0.85 | 16,860 | 2.352 |
 Saudi Arabia Saudi Arabia |
28,675.8 | 0.858 | 1,435 | 19.983 |
 United States of America United States of America |
27,744.35 | 0.085 | 2,665 | 10.411 |
 Uzbekistan Uzbekistan |
27,673.09 | 0.847 | 1,324 | 20.901 |
 Tunisia Tunisia |
23,764.13 | 2.076 | 16,403 | 1.449 |
 Albania Albania |
23,350.24 | 8.135 | 1,518 | 15.382 |
 Brazil Brazil |
20,881 | 0.1 | 2,006 | 10.409 |
 India India |
14,874.84 | 0.011 | 5,931 | 2.508 |
 China China |
13,726.36 | 0.01 | 2,576 | 5.329 |
 Italy Italy |
13,030 | 0.216 | 2,070 | 6.295 |
 Mexico Mexico |
12,489.34 | 0.1 | 1,925 | 6.488 |
 Japan Japan |
12,281.31 | 0.097 | 942 | 13.037 |
 Azerbaijan Azerbaijan |
11,913.7 | 1.204 | 1,917 | 6.215 |
 Libya Libya |
10,239.08 | 1.582 | 2,656 | 3.855 |
 Greece Greece |
8,440 | 0.784 | 1,130 | 7.469 |
 Iraq Iraq |
7,465.08 | 0.19 | 899 | 8.304 |
 France France |
7,190 | 0.107 | 830 | 8.663 |
 Yemen Yemen |
4,965.52 | 0.172 | 490 | 10.134 |
 Bosnia and Herzegovina Bosnia and Herzegovina |
3,795 | 1.003 | 446 | 8.509 |
 Montenegro Montenegro |
3,773.92 | 6.064 | 1,354 | 2.787 |
 Palestinian Territories Palestinian Territories |
3,399.94 | 0.747 | 298 | 11.409 |
 Portugal Portugal |
3,170 | 0.308 | 3,700 | 0.857 |
 Lebanon Lebanon |
3,061.39 | 0.502 | 562 | 5.447 |
 Peru Peru |
2,586.97 | 0.083 | 448 | 5.774 |
 Colombia Colombia |
2,451.2 | 0.049 | 101 | 24.269 |
 Israel Israel |
2,380 | 0.267 | 70 | 34 |
 Armenia Armenia |
2,095.3 | 0.706 | 263 | 7.967 |
 South Africa South Africa |
1,745.75 | 0.03 | 523 | 3.338 |
 Jordan Jordan |
1,378 | 0.135 | 143 | 9.636 |
 Tajikistan Tajikistan |
1,220.91 | 0.137 | 316 | 3.864 |
 Cyprus Cyprus |
1,000 | 1.17 | 190 | 5.263 |
 Macedonia Macedonia |
906 | 0.437 | 52 | 17.423 |
 Argentina Argentina |
867.56 | 0.019 | 271 | 3.201 |
 Croatia Croatia |
740 | 0.177 | 500 | 1.48 |
 Bolivia Bolivia |
654.57 | 0.058 | 130 | 5.035 |
 United Arab Emirates United Arab Emirates |
601.09 | 0.063 | 62 | 9.695 |
 Pakistan Pakistan |
209.43 | 0.001 | 129 | 1.623 |
 Bulgaria Bulgaria |
130 | 0.018 | 40 | 3.25 |
 Slovenia Slovenia |
130 | 0.063 | 30 | 4.333 |
 Chile Chile |
126.05 | 0.007 | 72 | 1.751 |
 Qatar Qatar |
108 | 0.044 | 36 | 3 |
 Cameroon Cameroon |
94.08 | 0.004 | 33 | 2.851 |
 Australia Australia |
71.91 | 0.003 | 69 | 1.042 |
 Malta Malta |
59 | 0.124 | 26 | 2.269 |
 Ecuador Ecuador |
36.28 | 0.002 | 32 | 1.134 |
Top Fig Producing Countries by Share
- Turkey dominates the global fig market, contributing approximately 27.3% to the global fig production, underscoring its leading position.
- With a 14.8% share, Egypt stands as the second-largest producer, solidifying its importance in the fig industry.
- Morocco holds a 9.1% share of the global production, indicating its significant contribution.
- Algeria accounts for about 8.9% of the worldwide fig production, marking its substantial involvement.
- Together, these countries account for a significant portion of the global fig market, demonstrating the concentration of fig production in a few key regions.