Countries by Grape production
Grapes are a versatile fruit with significant economic and cultural importance across the globe. They thrive in temperate climates and are grown in regions that offer a balance of sunlight, warmth, and adequate water. Grapes are vital for making wine, raisins, fresh consumption, and juices. This report highlights the latest data for 2023, according to the Food and Agriculture Organization (FAO) stats database.
Global Grape Production
In 2023, the worldwide grape production was approximately 72.5 million tonnes. Over the decades, grape production has shown a general upward trend. Since 1961, when production was around 43 million tonnes, there has been significant growth. Interestingly, production peaked in 2018 with over 80 million tonnes. Despite a slight decline in recent years, grapes remain a key agricultural commodity globally.
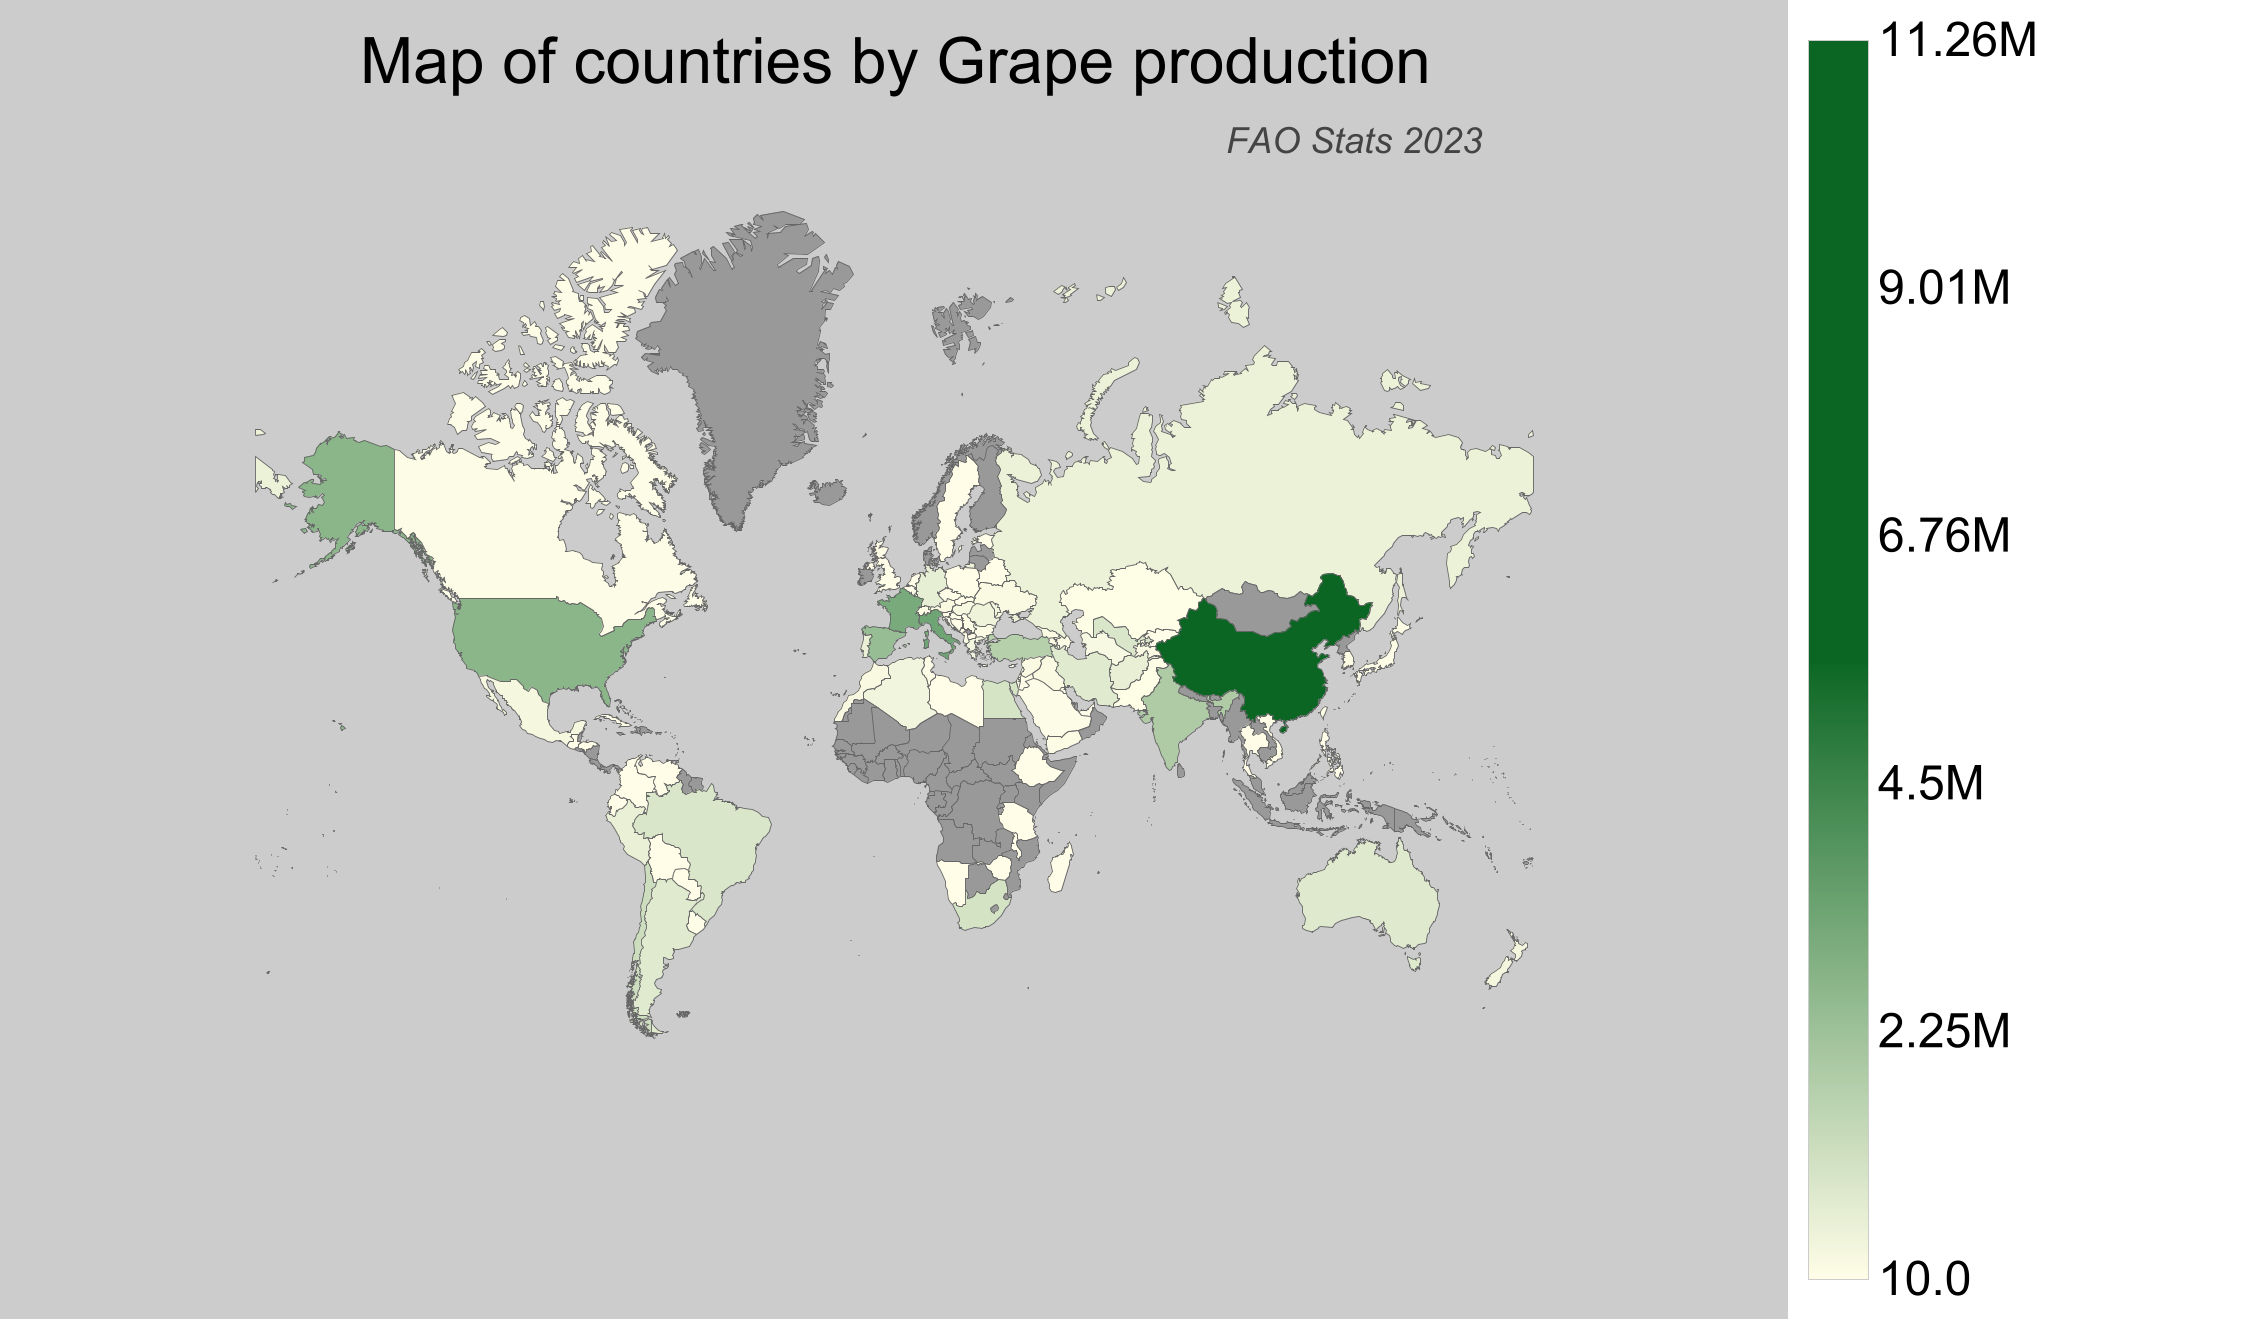
Grape Production by Country
- China leads the world with grape production of approximately 11.3 million tonnes.
- Italy follows as a major producer with around 6.7 million tonnes.
- France contributes significantly with a production volume of about 6.2 million tonnes.
- The United States of America adds to the global supply with about 5.4 million tonnes.
- Canada, although not among the top producers, still participates with a production of around 104,000 tonnes.
| Country | Production (tonnes) | Production per Person (kg) | Harvested Area (ha) | Yield (kg/ha) |
|---|---|---|---|---|
 China China |
11,269,900 | 8.085 | 582,728 | 19.34 |
 Italy Italy |
6,668,830 | 110.344 | 713,350 | 9.349 |
 France France |
6,205,260 | 92.207 | 753,340 | 8.237 |
 United States of America United States of America |
5,361,010 | 16.356 | 360,579 | 14.868 |
 Spain Spain |
4,822,760 | 103.361 | 913,000 | 5.282 |
 India India |
3,740,000 | 2.798 | 169,000 | 22.13 |
 Turkey Turkey |
3,400,000 | 39.826 | 377,848 | 8.998 |
 Chile Chile |
2,320,962.28 | 132.068 | 171,931 | 13.499 |
 South Africa South Africa |
1,973,818.52 | 34.193 | 111,169 | 17.755 |
 Egypt Egypt |
1,924,399.33 | 19.738 | 83,162 | 23.14 |
 Brazil Brazil |
1,757,891 | 8.39 | 77,019 | 22.824 |
 Uzbekistan Uzbekistan |
1,731,677.76 | 53.031 | 112,851 | 15.345 |
 Australia Australia |
1,550,060 | 61.88 | 123,844 | 12.516 |
 Iran Iran |
1,473,241.99 | 18.02 | 113,550 | 12.974 |
 Argentina Argentina |
1,455,312 | 32.708 | 204,847 | 7.104 |
 Germany Germany |
1,174,050 | 14.189 | 101,160 | 11.606 |
 Afghanistan Afghanistan |
1,086,000 | 34.394 | 93,000 | 11.677 |
 Peru Peru |
1,011,070.89 | 32.367 | 37,453 | 26.996 |
 Portugal Portugal |
999,740 | 97.147 | 175,810 | 5.686 |
 Russian Federation Russian Federation |
883,894.64 | 6.018 | 82,007 | 10.778 |
 Romania Romania |
801,100 | 41.032 | 164,170 | 4.88 |
 Algeria Algeria |
619,740.16 | 14.566 | 64,465 | 9.614 |
 Moldova Moldova |
571,100 | 160.832 | 102,284 | 5.583 |
 Greece Greece |
564,210 | 52.396 | 79,420 | 7.104 |
 New Zealand New Zealand |
532,000 | 108.547 | 34,604 | 15.374 |
 Mexico Mexico |
481,128.87 | 3.857 | 35,632 | 13.503 |
 Hungary Hungary |
410,980 | 42.061 | 57,530 | 7.144 |
 Turkmenistan Turkmenistan |
330,435.05 | 56.47 | 19,212 | 17.199 |
 Austria Austria |
310,760 | 35.161 | 42,590 | 7.297 |
 Morocco Morocco |
309,602.34 | 8.903 | 40,341 | 7.675 |
 Iraq Iraq |
272,109.58 | 6.917 | 16,160 | 16.838 |
 Tajikistan Tajikistan |
266,135.27 | 29.799 | 33,555 | 7.931 |
 Ukraine Ukraine |
244,870 | 5.794 | 26,300 | 9.311 |
 Syria Syria |
233,749 | 12.784 | 43,336 | 5.394 |
 Azerbaijan Azerbaijan |
224,517.1 | 22.683 | 14,233 | 15.774 |
 Georgia Georgia |
220,700 | 59.175 | 62,142 | 3.552 |
 Armenia Armenia |
213,425.5 | 71.865 | 14,316 | 14.908 |
 South Korea South Korea |
185,232.83 | 3.587 | 14,890 | 12.44 |
 Albania Albania |
179,705.3 | 62.608 | 9,822 | 18.296 |
 Japan Japan |
167,000 | 1.32 | 16,400 | 10.183 |
 Tunisia Tunisia |
159,627.28 | 13.946 | 22,290 | 7.161 |
 Macedonia Macedonia |
149,006 | 71.8 | 21,972 | 6.782 |
 Bulgaria Bulgaria |
147,800 | 20.964 | 28,400 | 5.204 |
 Yemen Yemen |
138,839.3 | 4.802 | 11,730 | 11.836 |
 Serbia Serbia |
131,525.63 | 18.786 | 18,349 | 7.168 |
 Switzerland Switzerland |
127,853 | 15.054 | 14,569 | 8.776 |
 Canada Canada |
104,016 | 2.795 | 11,832 | 8.791 |
 Saudi Arabia Saudi Arabia |
103,465.66 | 3.097 | 4,935 | 20.966 |
 Uruguay Uruguay |
98,348.93 | 28.052 | 5,848 | 16.818 |
 Croatia Croatia |
94,910 | 22.64 | 19,830 | 4.786 |
 Thailand Thailand |
80,898.65 | 1.169 | 4,805 | 16.836 |
 Slovenia Slovenia |
78,720 | 38.086 | 14,430 | 5.455 |
 Czech Republic Czech Republic |
76,980 | 7.253 | 16,280 | 4.729 |
 Taiwan Taiwan |
69,900 | 2.965 | 2,467 | 28.334 |
 Kazakhstan Kazakhstan |
63,501.72 | 3.475 | 10,744 | 5.91 |
 Israel Israel |
62,583 | 7.026 | 8,213 | 7.62 |
 Pakistan Pakistan |
62,413.29 | 0.309 | 16,023 | 3.895 |
 Lebanon Lebanon |
55,013.9 | 9.028 | 6,340 | 8.677 |
 Palestinian Territories Palestinian Territories |
41,937.18 | 9.217 | 3,228 | 12.992 |
 Slovakia Slovakia |
40,700 | 7.477 | 9,030 | 4.507 |
 Jordan Jordan |
39,543 | 3.865 | 3,258 | 12.137 |
 Namibia Namibia |
38,940.72 | 16.134 | 9,248 | 4.211 |
 Belarus Belarus |
36,865.93 | 3.89 | 8,895 | 4.145 |
 Colombia Colombia |
33,993 | 0.681 | 2,984 | 11.392 |
 Libya Libya |
30,824.35 | 4.763 | 8,109 | 3.801 |
 Bosnia and Herzegovina Bosnia and Herzegovina |
26,674 | 7.048 | 3,168 | 8.42 |
 Vietnam Vietnam |
24,923.76 | 0.263 | 1,058 | 23.557 |
 Bolivia Bolivia |
23,066.26 | 2.04 | 3,311 | 6.967 |
 Cyprus Cyprus |
21,530 | 25.187 | 5,940 | 3.625 |
 Venezuela Venezuela |
21,068.13 | 0.662 | 1,576 | 13.368 |
 Guatemala Guatemala |
20,659.18 | 1.194 | 2,774 | 7.447 |
 Cuba Cuba |
19,881.23 | 1.772 | 1,530 | 12.994 |
 Tanzania Tanzania |
16,921.08 | 0.312 | 2,556 | 6.62 |
 Montenegro Montenegro |
15,402.38 | 24.748 | 2,353 | 6.546 |
 Madagascar Madagascar |
13,712.15 | 0.522 | 2,529 | 5.422 |
 Luxembourg Luxembourg |
10,880 | 18.073 | 1,220 | 8.918 |
 Poland Poland |
7,400 | 0.193 | 1,300 | 5.692 |
 Kyrgyzstan Kyrgyzstan |
5,111 | 0.81 | 4,117 | 1.241 |
 Ethiopia Ethiopia |
4,838.35 | 0.045 | 2,326 | 2.08 |
 Zimbabwe Zimbabwe |
3,572.48 | 0.241 | 431 | 8.289 |
 Malta Malta |
2,880 | 6.054 | 420 | 6.857 |
 The Netherlands The Netherlands |
2,460 | 0.143 | 250 | 9.84 |
 Belgium Belgium |
2,388.52 | 0.209 | 251 | 9.516 |
 Ecuador Ecuador |
555.21 | 0.033 | 78 | 7.118 |
 Paraguay Paraguay |
539.37 | 0.076 | 137 | 3.937 |
 United Kingdom United Kingdom |
512.12 | 0.008 | 456 | 1.123 |
 Sweden Sweden |
310 | 0.03 | 120 | 2.583 |
 Kuwait Kuwait |
219.58 | 0.052 | 22 | 9.981 |
 Malawi Malawi |
210.08 | 0.012 | 47 | 4.47 |
 Honduras Honduras |
187.04 | 0.021 | 39 | 4.796 |
 Philippines Philippines |
184.98 | 0.002 | 307 | 0.603 |
 United Arab Emirates United Arab Emirates |
34.98 | 0.004 | 14 | 2.499 |
 Estonia Estonia |
10 | 0.008 | 10 | 1 |
Top Grape Producing Countries by Share
- China's production accounts for about 15.5% of the global total, making it a dominant player in the grape production market.
- Italy contributes approximately 9.2%, maintaining its reputation as a top wine-producing country.
- France holds a share of roughly 8.6% of the global production, reflecting its strong viticulture tradition.
- The United States comes in with a 7.4% share, underlining its role as a key player in grape cultivation.
- Canada's share stands at 0.14%, highlighting its smaller but significant contribution to the global market.