Countries by Lemon production
Lemons are not only a staple in culinary arts and refreshing beverages, but they also play a crucial role in various industrial applications due to their richness in vitamin C and antioxidants. Lemons thrive in a Mediterranean climate, characterized by mild, wet winters and hot, dry summers. The data presented here for the year 2023 provides insights into Lemon production trends as recorded in the Food and Agriculture Organization (FAO) stats database.

Global Lemon Production
In 2023, global Lemon production reached around 23.6 million tonnes. Over the years, Lemon production has shown a significant upward trend, from approximately 2.6 million tonnes in 1961 to the current figures. Notable shifts include the rapid increase during the early 2000s and the steady growth in recent years, underscoring the rising demand and strategic cultivation improvements globally.
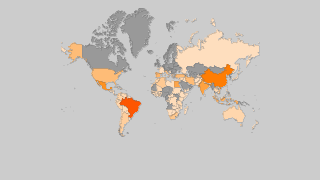
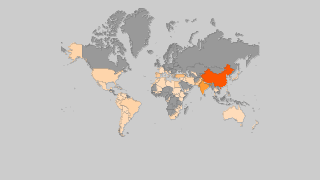
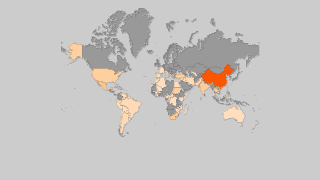
Lemon Production by Country
- India: With a production of approximately 3.8 million tonnes, India leads the world in Lemon production as of 2023.
- Mexico: Producing around 3.2 million tonnes, Mexico is a key player in the global Lemon industry.
- China: China contributes about 2.6 million tonnes to the global Lemon market, showcasing significant agricultural output.
- Turkey: Known for its favorable climate for citrus fruits, Turkey produced around 2.3 million tonnes.
- Canada: According to FAO stats, Canada does not produce any Lemons in 2023.
| Country | Production (tonnes) | Production per Person (kg) | Harvested Area (ha) | Yield (kg/ha) |
|---|---|---|---|---|
 India India |
3,787,000 | 2.834 | 312,000 | 12.138 |
 Mexico Mexico |
3,249,216.79 | 26.048 | 210,735 | 15.418 |
 China China |
2,610,791.1 | 1.873 | 121,348 | 21.515 |
 Turkey Turkey |
2,325,726 | 27.242 | 56,439 | 41.208 |
 Argentina Argentina |
1,998,272.53 | 44.911 | 58,368 | 34.236 |
 Brazil Brazil |
1,724,330 | 8.229 | 66,399 | 25.969 |
 Spain Spain |
1,148,870 | 24.623 | 51,670 | 22.235 |
 United States of America United States of America |
1,012,420 | 3.089 | 24,039 | 42.116 |
 South Africa South Africa |
809,887.93 | 14.03 | 36,909 | 21.943 |
 Colombia Colombia |
541,235.62 | 10.84 | 41,479 | 13.048 |
 Iran Iran |
492,925.96 | 6.029 | 28,720 | 17.163 |
 Italy Italy |
472,960 | 7.826 | 24,780 | 19.086 |
 Sudan Sudan |
396,777.92 | 9.726 | 32,247 | 12.304 |
 Egypt Egypt |
359,451.66 | 3.687 | 18,347 | 19.592 |
 Peru Peru |
339,051.72 | 10.854 | 28,453 | 11.916 |
 Chile Chile |
261,959.57 | 14.906 | 9,458 | 27.697 |
 Thailand Thailand |
166,775 | 2.411 | 16,372 | 10.187 |
 Syria Syria |
135,691 | 7.421 | 7,481 | 18.138 |
 Guatemala Guatemala |
132,029.47 | 7.631 | 5,985 | 22.06 |
 Lebanon Lebanon |
107,244.83 | 17.6 | 3,594 | 29.84 |
 Bangladesh Bangladesh |
99,930 | 0.605 | 63,385 | 1.577 |
 Pakistan Pakistan |
97,573 | 0.483 | 12,006 | 8.127 |
 Venezuela Venezuela |
90,952.35 | 2.858 | 7,132 | 12.753 |
 Algeria Algeria |
89,860.27 | 2.112 | 4,034 | 22.276 |
 Dominican Republic Dominican Republic |
82,962.52 | 8.081 | 44,735 | 1.855 |
 Australia Australia |
73,120 | 2.919 | 3,111 | 23.504 |
 Greece Greece |
72,780 | 6.759 | 3,420 | 21.281 |
 Israel Israel |
70,487 | 7.913 | 2,621 | 26.893 |
 Zimbabwe Zimbabwe |
68,341.38 | 4.602 | 1,706 | 40.059 |
 Saudi Arabia Saudi Arabia |
66,333.21 | 1.985 | 3,337 | 19.878 |
 Nepal Nepal |
61,485 | 2.104 | 8,385 | 7.333 |
 Tunisia Tunisia |
59,355.08 | 5.186 | 3,981 | 14.91 |
 Kenya Kenya |
59,118.22 | 1.16 | 5,860 | 10.088 |
 Jordan Jordan |
49,779 | 4.865 | 2,548 | 19.536 |
 Uruguay Uruguay |
49,348.5 | 14.076 | 2,071 | 23.828 |
 Ghana Ghana |
48,936.86 | 1.652 | 7,394 | 6.618 |
 Mali Mali |
42,041.1 | 2.2 | 5,367 | 7.833 |
 Taiwan Taiwan |
38,859 | 1.648 | 2,594 | 14.98 |
 Morocco Morocco |
38,197.79 | 1.098 | 3,578 | 10.676 |
 Portugal Portugal |
36,210 | 3.519 | 1,760 | 20.574 |
 Costa Rica Costa Rica |
35,828.61 | 7.161 | 1,727 | 20.746 |
 Honduras Honduras |
34,566.47 | 3.836 | 1,068 | 32.366 |
 Bolivia Bolivia |
32,717.62 | 2.893 | 4,370 | 7.487 |
 Yemen Yemen |
29,700.7 | 1.027 | 2,584 | 11.494 |
 Ecuador Ecuador |
28,107.46 | 1.647 | 4,987 | 5.636 |
 Jamaica Jamaica |
25,882.43 | 9.485 | 1,539 | 16.818 |
 Libya Libya |
23,894.68 | 3.693 | 2,323 | 10.286 |
 El Salvador El Salvador |
20,518.41 | 3.089 | 1,317 | 15.58 |
 Malaysia Malaysia |
17,484.97 | 0.535 | 1,007 | 17.363 |
 Somalia Somalia |
16,304.85 | 1.074 | 2,641 | 6.174 |
 Palestinian Territories Palestinian Territories |
15,459.21 | 3.398 | 507 | 30.492 |
 Malawi Malawi |
14,324.76 | 0.799 | 2,569 | 5.576 |
 France France |
14,300 | 0.212 | 2,580 | 5.543 |
 Sri Lanka Sri Lanka |
14,041 | 0.655 | 8,800 | 1.596 |
 Panama Panama |
13,243.55 | 3.184 | 1,039 | 12.746 |
 Uzbekistan Uzbekistan |
11,161.23 | 0.342 | 588 | 18.982 |
 Tanzania Tanzania |
10,406.37 | 0.192 | 2,144 | 4.854 |
 Paraguay Paraguay |
9,056.57 | 1.284 | 530 | 17.088 |
 United Arab Emirates United Arab Emirates |
9,000 | 0.943 | 203 | 44.335 |
 Guyana Guyana |
8,731.25 | 11.162 | 189 | 46.197 |
 Oman Oman |
8,331 | 1.663 | 1,721 | 4.841 |
 Laos Laos |
8,308.65 | 1.194 | 1,244 | 6.679 |
 Japan Japan |
8,133.6 | 0.064 | 549 | 14.815 |
 Congo-Kinshasa Congo-Kinshasa |
6,964.69 | 0.086 | 459 | 15.174 |
 New Zealand New Zealand |
6,950.8 | 1.418 | 363 | 19.148 |
 Rwanda Rwanda |
6,291.89 | 0.524 | 1,484 | 4.24 |
 Azerbaijan Azerbaijan |
6,149.6 | 0.621 | 535 | 11.495 |
 Albania Albania |
6,038.79 | 2.104 | 89 | 67.852 |
 Congo-Brazzaville Congo-Brazzaville |
5,236.43 | 0.97 | 472 | 11.094 |
 Iraq Iraq |
4,562.99 | 0.116 | 3,306 | 1.38 |
 Madagascar Madagascar |
4,481.4 | 0.171 | 1,389 | 3.226 |
 Guinea-Bissau Guinea-Bissau |
4,471.88 | 2.822 | 732 | 6.109 |
 Tajikistan Tajikistan |
4,401.15 | 0.493 | 309 | 14.243 |
 Cuba Cuba |
4,351.71 | 0.388 | 543 | 8.014 |
 Ethiopia Ethiopia |
4,175.24 | 0.039 | 1,680 | 2.485 |
 Cyprus Cyprus |
4,150 | 4.855 | 440 | 9.432 |
 Georgia Georgia |
3,100 | 0.831 | 1,058 | 2.93 |
 Mozambique Mozambique |
3,089.44 | 0.107 | 892 | 3.463 |
 Cambodia Cambodia |
3,004.24 | 0.187 | 300 | 10.014 |
 Djibouti Djibouti |
2,931.3 | 2.794 | 540 | 5.428 |
 Central African Republic Central African Republic |
2,866.8 | 0.605 | 544 | 5.27 |
 Trinidad and Tobago Trinidad and Tobago |
2,525.94 | 1.862 | 460 | 5.491 |
 The Bahamas The Bahamas |
2,311.58 | 6.062 | 186 | 12.428 |
 Tonga Tonga |
2,231.87 | 22.174 | 1,102 | 2.025 |
 Haiti Haiti |
1,867.53 | 0.168 | 443 | 4.216 |
 Dominica Dominica |
1,812.98 | 25.43 | 292 | 6.209 |
 Philippines Philippines |
1,174.49 | 0.011 | 585 | 2.008 |
 Vanuatu Vanuatu |
930 | 3.054 | 80 | 11.625 |
 Antigua and Barbuda Antigua and Barbuda |
430.96 | 4.994 | 91 | 4.736 |
 Croatia Croatia |
370 | 0.088 | 60 | 6.167 |
 Malta Malta |
357 | 0.75 | 25 | 14.28 |
 Burkina Faso Burkina Faso |
323.05 | 0.016 | 46 | 7.023 |
 Saint Lucia Saint Lucia |
294 | 1.644 | 20 | 14.7 |
 Grenada Grenada |
288.37 | 2.791 | 18 | 16.021 |
 Kuwait Kuwait |
219.01 | 0.052 | 10 | 21.901 |
 Suriname Suriname |
205.89 | 0.362 | 13 | 15.838 |
 Saint Vincent and the Grenadines Saint Vincent and the Grenadines |
149 | 1.36 | 17 | 8.765 |
 Bhutan Bhutan |
139.13 | 0.191 | 39 | 3.567 |
 Niue Niue |
108.52 | 66.823 | 28 | 3.876 |
 Brunei Brunei |
67.16 | 0.159 | 16 | 4.197 |
 Seychelles Seychelles |
55.57 | 0.59 | 3 | 18.523 |
 Maldives Maldives |
38 | 0.1 | 5 | 7.6 |
 Bosnia and Herzegovina Bosnia and Herzegovina |
13 | 0.003 | 1 | 13 |
 Cook Islands Cook Islands |
0.9 | 0.048 | 0 | ∞ |
 Kyrgyzstan Kyrgyzstan |
0.86 | 0 | 2 | 0.43 |
Top Lemon Producing Countries by Share
- India holds a dominant 16% share in global Lemon production, highlighting its significant contribution to the global market.
- Mexico makes up nearly 14% of the world's Lemon production, reinforcing its status as a major producer.
- China accounts for over 11% of global production, underscoring its agricultural capacity.
- Turkey contributes approximately 9.8% to the global output, showcasing its strong presence in the Lemon producing countries.