Countries by Grapefruit production
Grapefruit, a popular citrus fruit known for its tangy flavor and health benefits, thrives in subtropical climates. These conditions are essential for the cultivation of grapefruits, allowing growers to produce this fruit on a large scale. As of 2025, the latest data from the Food and Agriculture Organization (FAO) stats database indicates global grapefruit production figures for the year 2023, highlighting its agricultural significance worldwide.
Global Grapefruit Production
In 2023, worldwide grapefruit production reached approximately 9.93 million tonnes. This represents a significant increase from around 2.16 million tonnes in 1961, indicating a steadily growing trend over the decades. Notable changes include substantial growth in the late 20th century, with more recent years showing a consistent rise in production. From 1961 to 2023, production increased by more than four times, illustrating the expanding demand and cultivation of this citrus fruit.
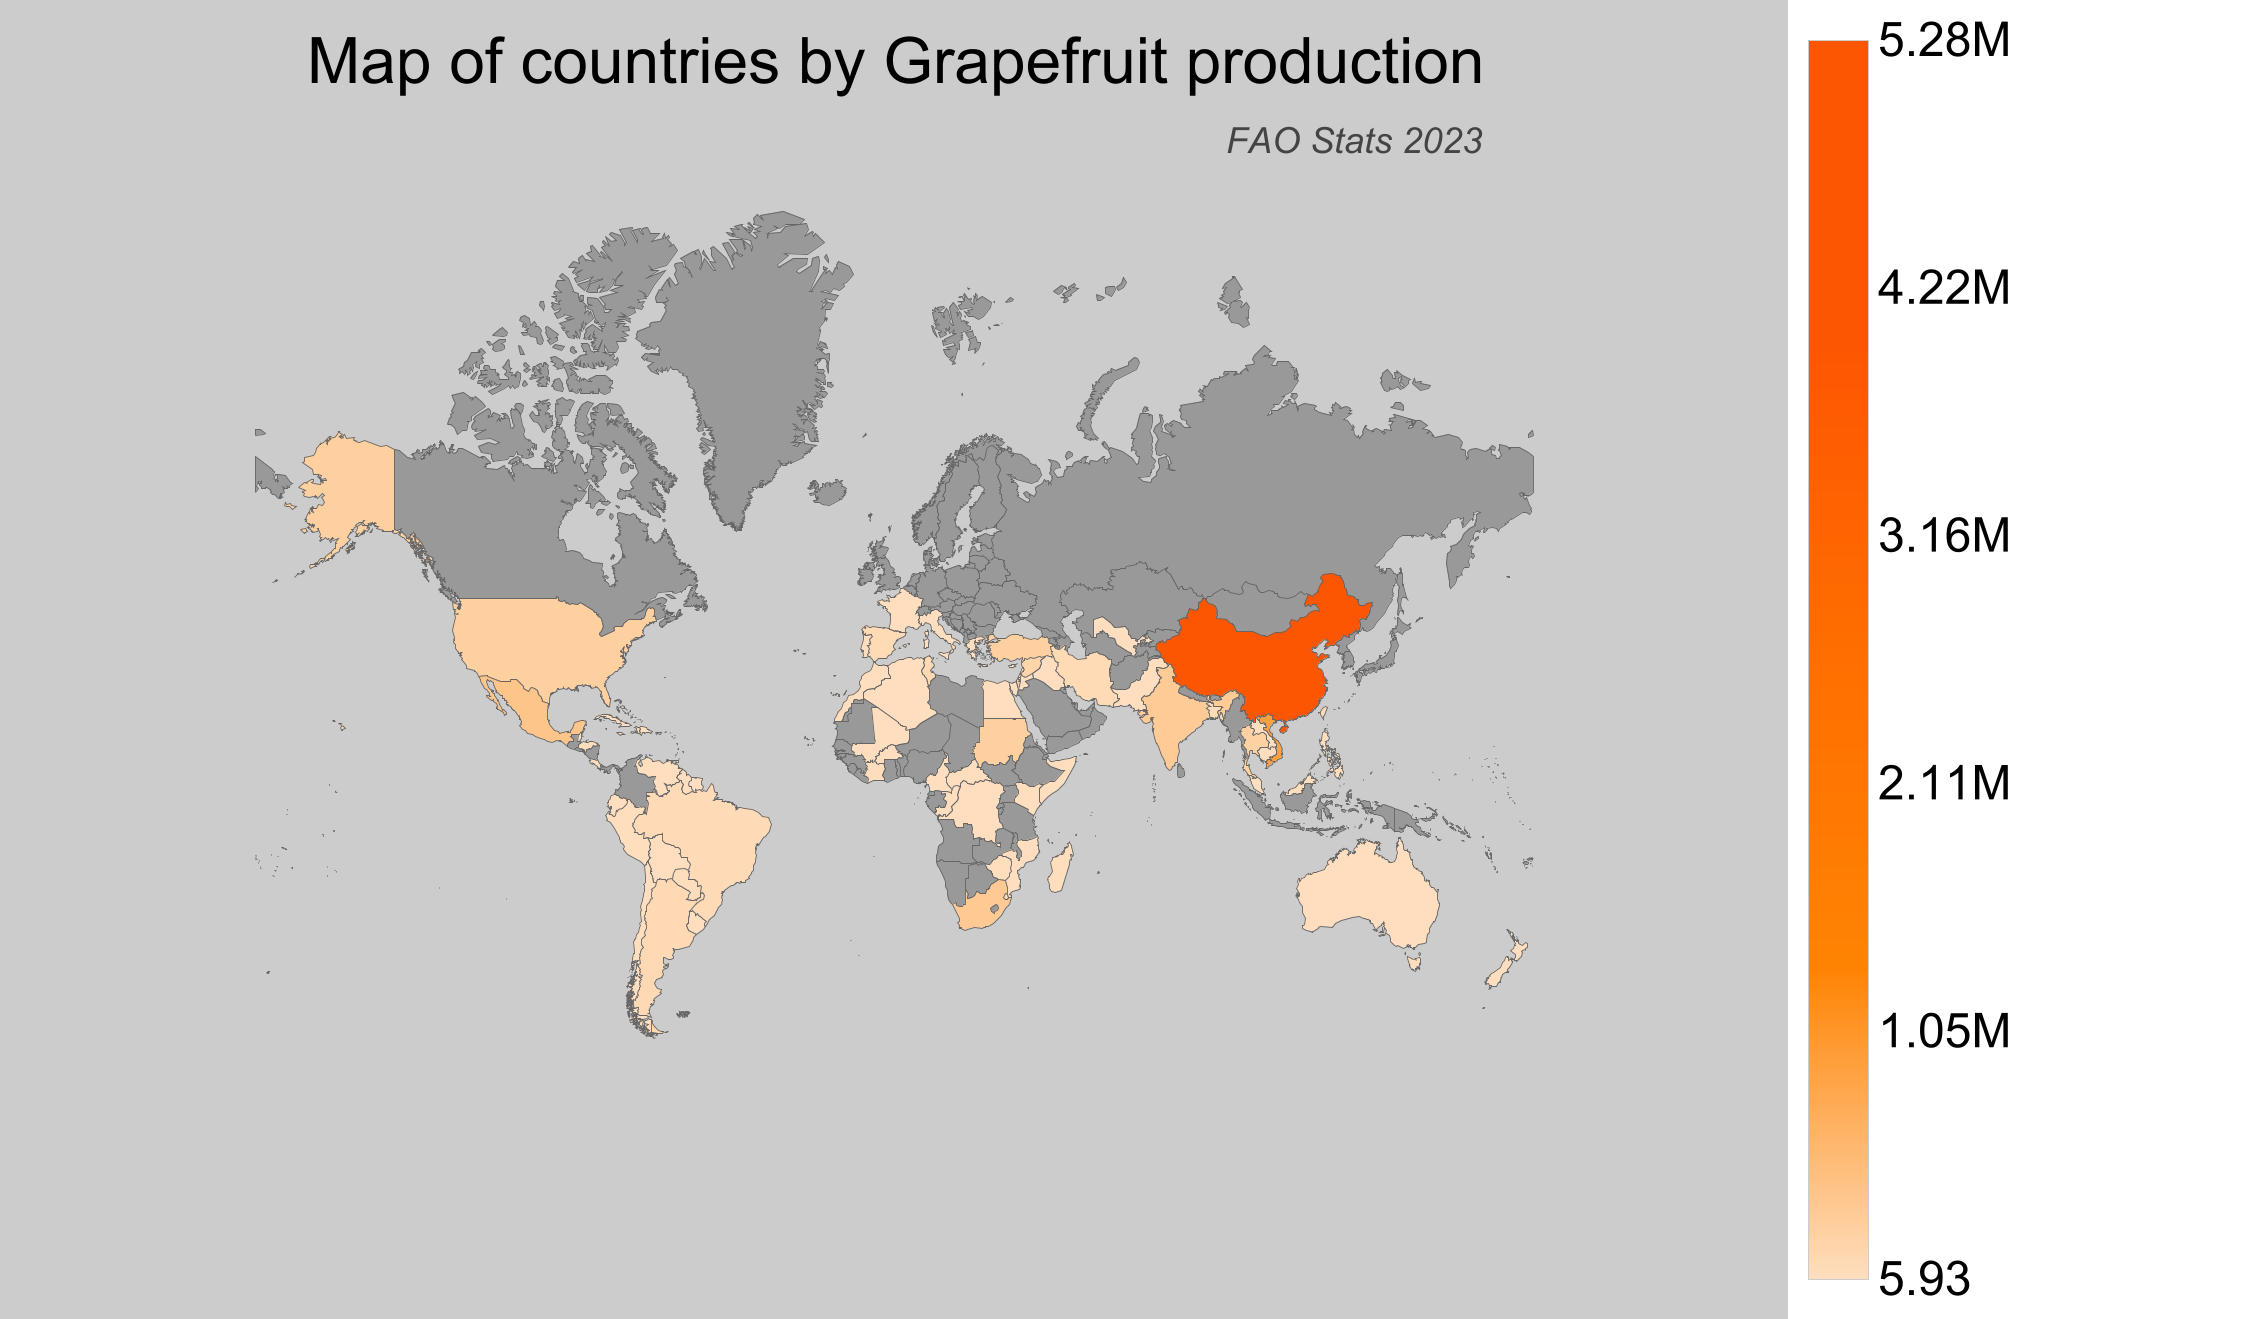
Grapefruit Production by Country
- China led global grapefruit production in 2023 with approximately 5.28 million tonnes.
- Vietnam produced around 1.2 million tonnes, making it a major contributor to global supplies.
- Mexico accounted for about 488,140 tonnes, maintaining its position as a significant producer.
- South Africa contributed around 410,794 tonnes, reflecting its robust citrus industry.
- Canada does not produce grapefruits, according to FAO statistics.
| Country | Production (tonnes) | Production per Person (kg) | Harvested Area (ha) | Yield (kg/ha) |
|---|---|---|---|---|
 China China |
5,281,732 | 3.789 | 104,468 | 50.558 |
 Vietnam Vietnam |
1,202,169.9 | 12.7 | 89,416 | 13.445 |
 Mexico Mexico |
488,140.72 | 3.913 | 20,870 | 23.39 |
 South Africa South Africa |
410,793.94 | 7.116 | 13,258 | 30.985 |
 India India |
390,500 | 0.292 | 16,271 | 24 |
 Sudan Sudan |
299,068.63 | 7.331 | 28,053 | 10.661 |
 United States of America United States of America |
296,650 | 0.905 | 13,193 | 22.485 |
 Turkey Turkey |
284,565 | 3.333 | 4,945 | 57.546 |
 Thailand Thailand |
268,324.18 | 3.878 | 17,760 | 15.108 |
 Syria Syria |
205,996 | 11.266 | 9,532 | 21.611 |
 Israel Israel |
156,573 | 17.577 | 1,509 | 103.759 |
 Tunisia Tunisia |
102,563.23 | 8.96 | 4,768 | 21.511 |
 Argentina Argentina |
100,615.8 | 2.261 | 3,869 | 26.006 |
 Iran Iran |
88,167.12 | 1.078 | 3,678 | 23.971 |
 Spain Spain |
85,290 | 1.828 | 3,400 | 25.085 |
 Brazil Brazil |
84,724.5 | 0.404 | 4,578 | 18.507 |
 Taiwan Taiwan |
81,732 | 3.467 | 4,609 | 17.733 |
 Bangladesh Bangladesh |
71,715 | 0.434 | 5,182 | 13.839 |
 Swaziland Swaziland |
49,097.58 | 42.353 | 4,668 | 10.518 |
 Jamaica Jamaica |
45,752.59 | 16.766 | 1,685 | 27.153 |
 Haiti Haiti |
40,140.14 | 3.612 | 5,503 | 7.294 |
 Philippines Philippines |
27,895.36 | 0.262 | 5,461 | 5.108 |
 Côte d'Ivoire Côte d'Ivoire |
25,394.89 | 1.02 | 4,581 | 5.544 |
 Honduras Honduras |
24,125.34 | 2.677 | 1,354 | 17.818 |
 Paraguay Paraguay |
22,142.51 | 3.139 | 845 | 26.204 |
 Costa Rica Costa Rica |
21,754.33 | 4.348 | 2,597 | 8.377 |
 The Bahamas The Bahamas |
21,291.25 | 55.836 | 546 | 38.995 |
 Dominica Dominica |
20,006.83 | 280.628 | 3,113 | 6.427 |
 Malaysia Malaysia |
17,051.72 | 0.522 | 1,005 | 16.967 |
 Cyprus Cyprus |
13,920 | 16.285 | 360 | 38.667 |
 Madagascar Madagascar |
12,796.32 | 0.487 | 1,617 | 7.914 |
 Peru Peru |
10,946.22 | 0.35 | 957 | 11.438 |
 Zimbabwe Zimbabwe |
9,448.56 | 0.636 | 969 | 9.751 |
 Congo-Kinshasa Congo-Kinshasa |
9,233.81 | 0.114 | 610 | 15.137 |
 Australia Australia |
9,030 | 0.36 | 1,379 | 6.548 |
 Mozambique Mozambique |
8,779.48 | 0.304 | 2,562 | 3.427 |
 France France |
8,650 | 0.129 | 380 | 22.763 |
 Lebanon Lebanon |
8,358.81 | 1.372 | 870 | 9.608 |
 Jordan Jordan |
7,984 | 0.78 | 446 | 17.901 |
 Venezuela Venezuela |
7,725.66 | 0.243 | 1,018 | 7.589 |
 Egypt Egypt |
6,940.35 | 0.071 | 468 | 14.83 |
 Laos Laos |
6,409.4 | 0.921 | 1,437 | 4.46 |
 Cuba Cuba |
6,200.01 | 0.553 | 1,400 | 4.429 |
 Somalia Somalia |
5,901.09 | 0.389 | 1,235 | 4.778 |
 Central African Republic Central African Republic |
5,622.23 | 1.187 | 749 | 7.506 |
 Italy Italy |
5,550 | 0.092 | 300 | 18.5 |
 Dominican Republic Dominican Republic |
5,440.13 | 0.53 | 509 | 10.688 |
 Congo-Brazzaville Congo-Brazzaville |
5,305.98 | 0.983 | 309 | 17.171 |
 Ecuador Ecuador |
4,792.46 | 0.281 | 434 | 11.043 |
 Bolivia Bolivia |
4,184.02 | 0.37 | 484 | 8.645 |
 Cambodia Cambodia |
3,424.58 | 0.213 | 328 | 10.441 |
 Kenya Kenya |
3,308.27 | 0.065 | 247 | 13.394 |
 Greece Greece |
2,850 | 0.265 | 190 | 15 |
 Uzbekistan Uzbekistan |
2,645.23 | 0.081 | 144 | 18.37 |
 Belize Belize |
2,234 | 5.643 | 486 | 4.597 |
 Algeria Algeria |
1,708.72 | 0.04 | 66 | 25.89 |
 Pakistan Pakistan |
1,696 | 0.008 | 130 | 13.046 |
 Grenada Grenada |
1,557.7 | 15.075 | 145 | 10.743 |
 Mali Mali |
1,293 | 0.068 | 124 | 10.427 |
 Trinidad and Tobago Trinidad and Tobago |
1,280.05 | 0.944 | 156 | 8.205 |
 Guyana Guyana |
1,162.6 | 1.486 | 449 | 2.589 |
 Suriname Suriname |
1,028.13 | 1.809 | 68 | 15.12 |
 Chile Chile |
840.94 | 0.048 | 193 | 4.357 |
 Palestinian Territories Palestinian Territories |
789.4 | 0.173 | 28 | 28.193 |
 New Zealand New Zealand |
767.27 | 0.157 | 31 | 24.751 |
 Uruguay Uruguay |
740.03 | 0.211 | 56 | 13.215 |
 Morocco Morocco |
525 | 0.015 | 20 | 26.25 |
 Saint Lucia Saint Lucia |
494 | 2.762 | 20 | 24.7 |
 Burkina Faso Burkina Faso |
257.16 | 0.013 | 17 | 15.127 |
 Iraq Iraq |
226.01 | 0.006 | 35 | 6.457 |
 Portugal Portugal |
160 | 0.016 | 20 | 8 |
 Cameroon Cameroon |
132.46 | 0.006 | 12 | 11.038 |
 Saint Vincent and the Grenadines Saint Vincent and the Grenadines |
99 | 0.904 | 4 | 24.75 |
 Malta Malta |
7 | 0.015 | 1 | 7 |
 Cook Islands Cook Islands |
5.93 | 0.319 | 0 | ∞ |
Top Grapefruit Producing Countries by Share
- China's production constituted over 53% of global output, making it the dominant player in grapefruit production.
- Vietnam held a respectable share with over 12%, emphasizing its growing contribution to the grapefruit market.
- Mexico and South Africa produced nearly 5% and 4% of global totals, respectively.
- The combined production of these top countries highlights a significant concentration, with China alone providing more than half of the world's grapefruits.