Countries by Strawberry production
Strawberries are a beloved fruit known for their sweet flavor and nutritional benefits, rich in vitamin C and antioxidants. Typically grown in temperate climates, strawberries thrive in regions with well-drained soil and plenty of sunlight. As of 2023, the Food and Agriculture Organization (FAO) provides the latest insights into global strawberry production, showcasing the trends and leading production areas.
Global Strawberry Production
In 2023, global strawberry production reached around 10.5 million tonnes, marking a remarkable increase from the 1961 figure of about 754,000 tonnes. This upward trend highlights the growing demand and production capability over the decades. Notably, the last few years have seen significant increases, with a rise from approximately 9.1 million tonnes in 2019 to 10.5 million tonnes in 2023.
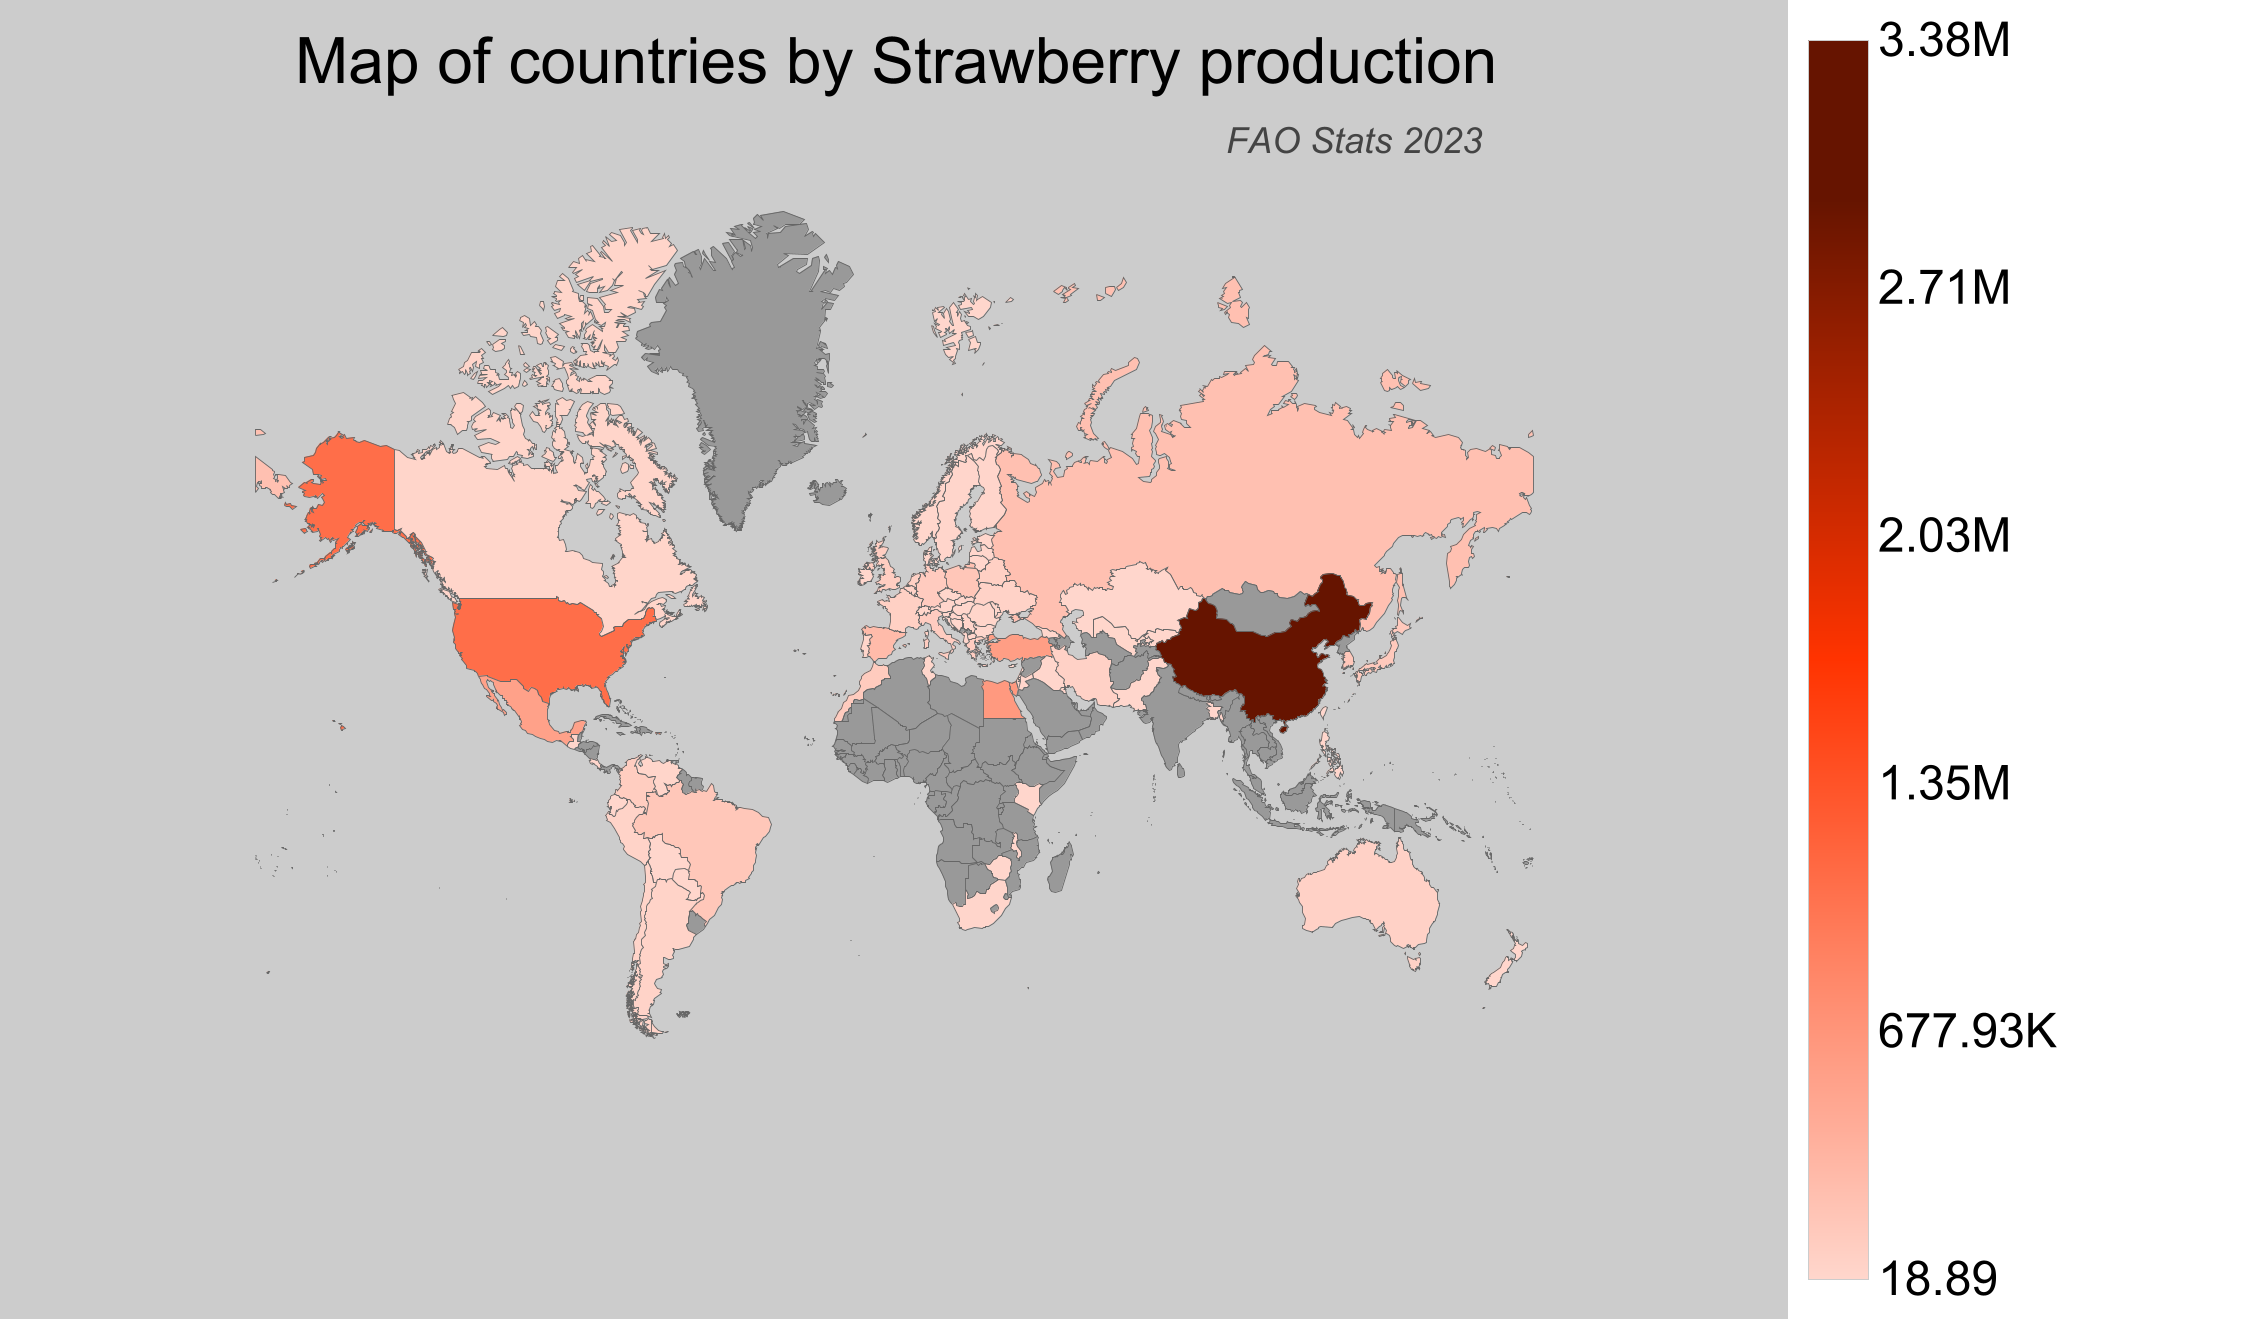
Strawberry Production by Country
- China stands as the largest producer with a staggering 3.4 million tonnes in 2023, illustrating its significant capacity to cultivate strawberries.
- The United States of America follows with a production of about 1.25 million tonnes, maintaining its substantial contribution to the global strawberry market.
- Egypt produced around 731,000 tonnes, making it one of the notable producers in the global arena.
- Turkey contributed with approximately 677,000 tonnes, showcasing its efficient agricultural practices.
- Despite its smaller volume, Canada produced around 22,000 tonnes, ranking 31st globally. Its presence signifies a valuable market niche catering to local demand.
| Country | Production (tonnes) | Production per Person (kg) | Harvested Area (ha) | Yield (kg/ha) |
|---|---|---|---|---|
 China China |
3,389,620.19 | 2.432 | 129,046 | 26.267 |
 United States of America United States of America |
1,250,100 | 3.814 | 22,986 | 54.385 |
 Egypt Egypt |
731,144.93 | 7.499 | 21,033 | 34.762 |
 Turkey Turkey |
676,818 | 7.928 | 21,984 | 30.787 |
 Mexico Mexico |
641,552.22 | 5.143 | 15,267 | 42.022 |
 Spain Spain |
329,280 | 7.057 | 7,310 | 45.045 |
 Russian Federation Russian Federation |
261,168.09 | 1.778 | 39,690 | 6.58 |
 Poland Poland |
194,500 | 5.061 | 30,000 | 6.483 |
 Brazil Brazil |
187,795.78 | 0.896 | 4,836 | 38.833 |
 South Korea South Korea |
177,682.33 | 3.441 | 5,842 | 30.415 |
 Japan Japan |
158,467.82 | 1.253 | 4,763 | 33.271 |
 Morocco Morocco |
137,275 | 3.948 | 3,292 | 41.7 |
 Germany Germany |
130,650 | 1.579 | 11,370 | 11.491 |
 Italy Italy |
119,920 | 1.984 | 4,350 | 27.568 |
 Colombia Colombia |
114,895.2 | 2.301 | 3,243 | 35.429 |
 Greece Greece |
107,740 | 10.005 | 2,520 | 42.754 |
 United Kingdom United Kingdom |
106,432.94 | 1.612 | 4,673 | 22.776 |
 The Netherlands The Netherlands |
79,070 | 4.583 | 1,420 | 55.683 |
 France France |
77,050 | 1.145 | 3,890 | 19.807 |
 Belarus Belarus |
76,132.43 | 8.032 | 9,664 | 7.878 |
 Australia Australia |
65,824 | 2.628 | 2,616 | 25.162 |
 Iran Iran |
64,906.4 | 0.794 | 4,475 | 14.504 |
 Ukraine Ukraine |
53,380 | 1.263 | 6,900 | 7.736 |
 Belgium Belgium |
51,450 | 4.507 | 1,400 | 36.75 |
 Argentina Argentina |
46,186.46 | 1.038 | 1,539 | 30.011 |
 Peru Peru |
43,139.06 | 1.381 | 2,436 | 17.709 |
 Chile Chile |
29,867.14 | 1.7 | 1,131 | 26.408 |
 Serbia Serbia |
23,703.89 | 3.386 | 7,229 | 3.279 |
 Israel Israel |
23,415 | 2.629 | 481 | 48.68 |
 Venezuela Venezuela |
22,907.67 | 0.72 | 1,237 | 18.519 |
 Canada Canada |
22,181 | 0.596 | 2,686 | 8.258 |
 Romania Romania |
20,640 | 1.057 | 2,840 | 7.268 |
 Portugal Portugal |
19,290 | 1.874 | 590 | 32.695 |
 Sweden Sweden |
15,700 | 1.544 | 1,630 | 9.632 |
 Austria Austria |
14,640 | 1.656 | 1,200 | 12.2 |
 Guatemala Guatemala |
14,273.3 | 0.825 | 687 | 20.776 |
 Finland Finland |
13,900 | 2.519 | 3,790 | 3.668 |
 South Africa South Africa |
13,273.7 | 0.23 | 1,050 | 12.642 |
 Moldova Moldova |
11,249 | 3.168 | 2,194 | 5.127 |
 Tunisia Tunisia |
10,100.6 | 0.882 | 405 | 24.94 |
 Uzbekistan Uzbekistan |
10,029.85 | 0.307 | 864 | 11.609 |
 Switzerland Switzerland |
9,568.75 | 1.127 | 510 | 18.762 |
 Taiwan Taiwan |
9,142 | 0.388 | 509 | 17.961 |
 Kazakhstan Kazakhstan |
9,009.79 | 0.493 | 1,084 | 8.312 |
 Hungary Hungary |
7,720 | 0.79 | 890 | 8.674 |
 Norway Norway |
6,842 | 1.288 | 914 | 7.486 |
 Ireland Ireland |
6,480 | 1.334 | 190 | 34.105 |
 Albania Albania |
6,370 | 2.219 | 119 | 53.529 |
 Macedonia Macedonia |
6,120 | 2.949 | 837 | 7.312 |
 Palestinian Territories Palestinian Territories |
5,851.09 | 1.286 | 166 | 35.248 |
 Denmark Denmark |
5,290 | 0.914 | 770 | 6.87 |
 Bulgaria Bulgaria |
5,210 | 0.739 | 760 | 6.855 |
 Bosnia and Herzegovina Bosnia and Herzegovina |
4,907 | 1.297 | 541 | 9.07 |
 Jordan Jordan |
4,603.84 | 0.45 | 158 | 29.138 |
 Paraguay Paraguay |
4,398.24 | 0.624 | 390 | 11.278 |
 Costa Rica Costa Rica |
4,375.02 | 0.874 | 151 | 28.974 |
 Bolivia Bolivia |
3,285.17 | 0.291 | 530 | 6.198 |
 Philippines Philippines |
3,111.93 | 0.029 | 325 | 9.575 |
 Slovakia Slovakia |
2,690 | 0.494 | 330 | 8.152 |
 Croatia Croatia |
2,380 | 0.568 | 240 | 9.917 |
 New Zealand New Zealand |
2,238.97 | 0.457 | 163 | 13.736 |
 Kyrgyzstan Kyrgyzstan |
2,133.25 | 0.338 | 415 | 5.14 |
 Lithuania Lithuania |
2,090 | 0.746 | 790 | 2.646 |
 Pakistan Pakistan |
2,054 | 0.01 | 559 | 3.674 |
 Lebanon Lebanon |
2,006.45 | 0.329 | 250 | 8.026 |
 Czech Republic Czech Republic |
1,900 | 0.179 | 400 | 4.75 |
 Slovenia Slovenia |
1,640 | 0.793 | 110 | 14.909 |
 Ecuador Ecuador |
1,443.36 | 0.085 | 102 | 14.151 |
 Estonia Estonia |
1,400 | 1.061 | 530 | 2.642 |
 Cyprus Cyprus |
1,260 | 1.474 | 50 | 25.2 |
 Georgia Georgia |
1,200 | 0.322 | 114 | 10.526 |
 Malta Malta |
934 | 1.963 | 50 | 18.68 |
 Latvia Latvia |
790 | 0.41 | 480 | 1.646 |
 Kenya Kenya |
533.07 | 0.01 | 72 | 7.404 |
 Zimbabwe Zimbabwe |
230.67 | 0.016 | 50 | 4.613 |
 Bangladesh Bangladesh |
210 | 0.001 | 34 | 6.176 |
 Kuwait Kuwait |
191 | 0.045 | 6 | 31.833 |
 Malawi Malawi |
132.83 | 0.007 | 105 | 1.265 |
 Luxembourg Luxembourg |
20 | 0.033 | 10 | 2 |
 Iraq Iraq |
18.89 | 0 | 5 | 3.778 |
Top Strawberry Producing Countries by Share
- China dominates the global strawberry production, accounting for over 32% of the total, highlighting its leading role in the industry.
- The United States holds about 12% of the global share, emphasizing its position as a major player.
- Egypt's share stands at approximately 7%, reflecting its strategic agricultural positioning.
- Turkey accounts for over 6% of the global production, underlining its commitment to strawberry cultivation.
- Canada, with around 0.2% of the global production, remains a committed player in the niche market sector.