Countries by Olive production
Olives are not only a staple in Mediterranean cuisine but also a major agricultural product in many regions with a warm, temperate climate. Olive trees thrive in areas with mild, rainy winters and hot, dry summers. They are valued for their oil and fruit, which play a crucial role in the diets and economies of producers worldwide. According to the latest data available up to 2025, this report focuses on the olive production statistics for the year 2023 from the Food and Agriculture Organization (FAO) stats database.
Global Olive Production
In 2023, global olive production was approximately 20.3 million tonnes. Over the years, olive production has seen significant growth, rising from around 8.2 million tonnes in 1961 to over 20 million tonnes in recent years. This substantial increase highlights the growing importance of olive cultivation. A comparison of the latest data point in 2023 with the earliest point in 1961 shows a remarkable increase, indicating robust growth in the industry.
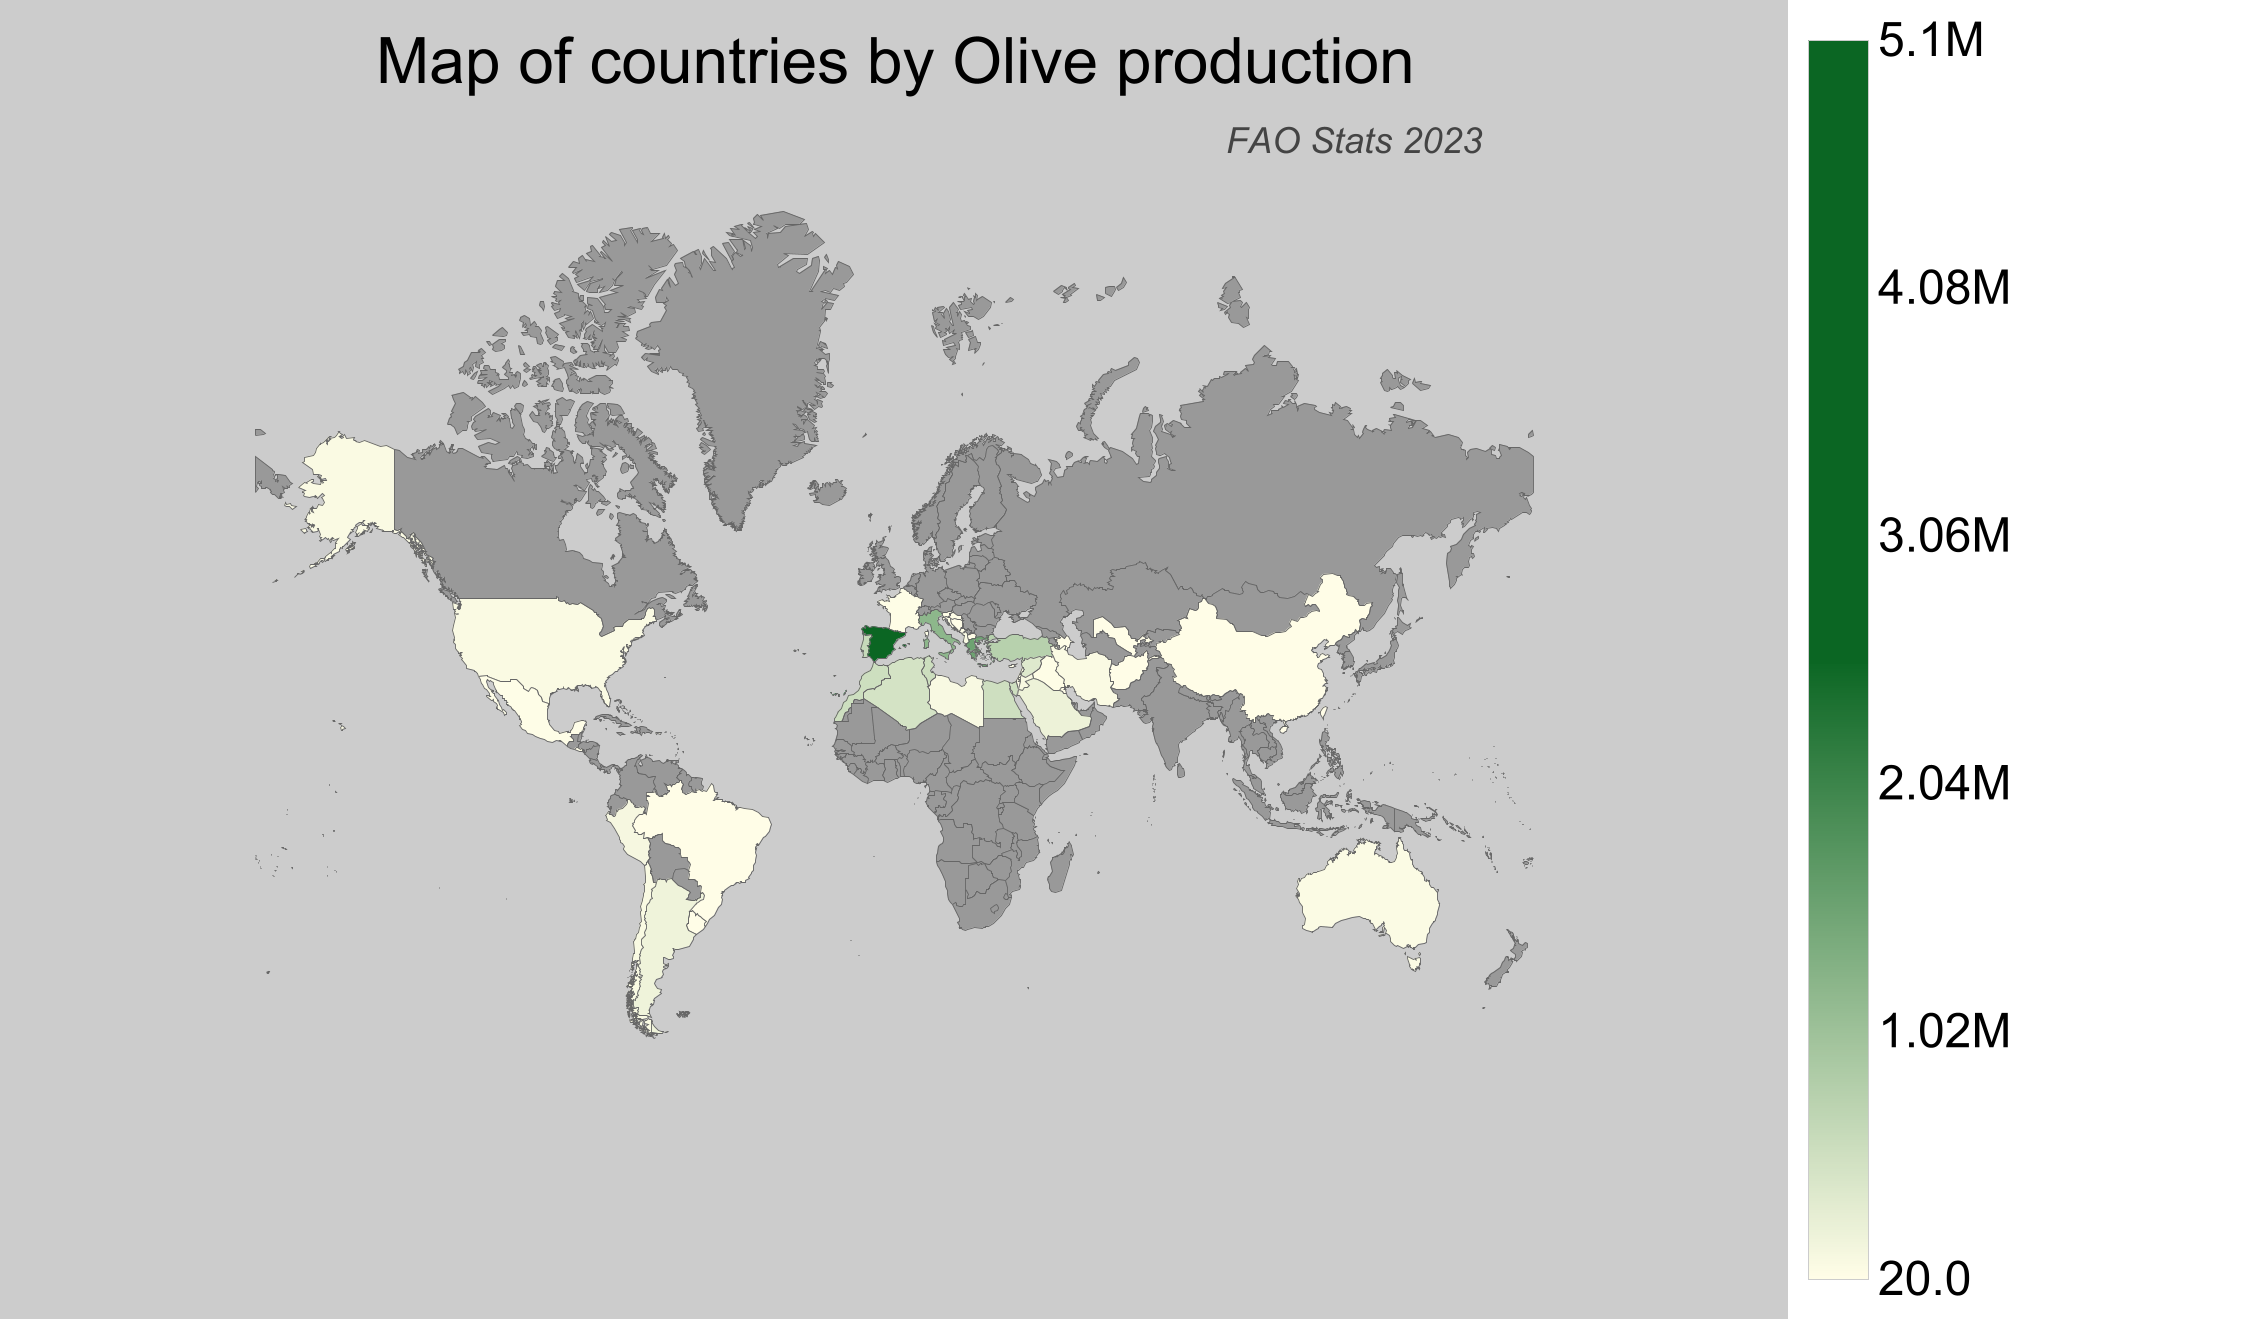
Olive Production by Country
- Spain: Leading the world in olive production with approximately 5.1 million tonnes.
- Greece: Producing around 3 million tonnes of olives, making it a significant player in the olive market.
- Italy: Contributing nearly 2.4 million tonnes to global olive production.
- Turkey: With about 1.5 million tonnes, Turkey remains a substantial producer.
- Canada: According to FAO statistics, Canada does not produce any olives.
| Country | Production (tonnes) | Production per Person (kg) | Harvested Area (ha) | Yield (kg/ha) |
|---|---|---|---|---|
 Spain Spain |
5,101,010 | 109.325 | 2,651,110 | 1.924 |
 Greece Greece |
3,045,100 | 282.787 | 826,390 | 3.685 |
 Italy Italy |
2,397,880 | 39.676 | 1,080,060 | 2.22 |
 Turkey Turkey |
1,520,000 | 17.804 | 903,061 | 1.683 |
 Portugal Portugal |
1,194,990 | 116.12 | 380,880 | 3.137 |
 Tunisia Tunisia |
1,077,206.21 | 94.11 | 1,934,447 | 0.557 |
 Morocco Morocco |
1,046,055.65 | 30.081 | 1,214,934 | 0.861 |
 Egypt Egypt |
1,034,309.92 | 10.609 | 114,102 | 9.065 |
 Algeria Algeria |
904,013.51 | 21.248 | 482,055 | 1.875 |
 Syria Syria |
697,325 | 38.138 | 674,767 | 1.033 |
 Saudi Arabia Saudi Arabia |
391,033.55 | 11.703 | 31,428 | 12.442 |
 Argentina Argentina |
344,714.98 | 7.747 | 125,562 | 2.745 |
 Peru Peru |
206,983 | 6.626 | 28,300 | 7.314 |
 Jordan Jordan |
169,458 | 16.563 | 57,840 | 2.93 |
 Libya Libya |
147,411.37 | 22.78 | 215,178 | 0.685 |
 Lebanon Lebanon |
136,176.33 | 22.348 | 63,147 | 2.156 |
 Chile Chile |
131,440.47 | 7.479 | 20,956 | 6.272 |
 Albania Albania |
117,618.05 | 40.977 | 50,404 | 2.334 |
 Iran Iran |
113,789.07 | 1.392 | 35,512 | 3.204 |
 Palestinian Territories Palestinian Territories |
110,771.4 | 24.345 | 53,288 | 2.079 |
 United States of America United States of America |
110,220 | 0.336 | 16,188 | 6.809 |
 Australia Australia |
100,536 | 4.014 | 40,665 | 2.472 |
 Israel Israel |
46,000 | 5.164 | 33,700 | 1.365 |
 Croatia Croatia |
29,850 | 7.121 | 20,790 | 1.436 |
 France France |
29,740 | 0.442 | 16,790 | 1.771 |
 Iraq Iraq |
29,210.25 | 0.743 | 7,059 | 4.138 |
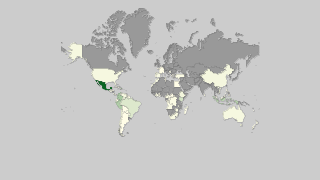
 Mexico Mexico |
23,653.15 | 0.19 | 5,249 | 4.506 |
 Cyprus Cyprus |
21,930 | 25.655 | 10,530 | 2.083 |
 Uruguay Uruguay |
14,000 | 3.993 | 5,070 | 2.761 |
 Macedonia Macedonia |
11,742.33 | 5.658 | 5,421 | 2.166 |
 El Salvador El Salvador |
11,451.24 | 1.724 | 5,649 | 2.027 |
 Afghanistan Afghanistan |
7,785.23 | 0.247 | 2,207 | 3.528 |
 Brazil Brazil |
6,864 | 0.033 | 3,867 | 1.775 |
 Azerbaijan Azerbaijan |
5,691.4 | 0.575 | 6,320 | 0.901 |
 Taiwan Taiwan |
2,628.1 | 0.111 | 316 | 8.317 |
 China China |
2,628.1 | 0.002 | 316 | 8.317 |
 Slovenia Slovenia |
1,310 | 0.634 | 1,620 | 0.809 |
 Kuwait Kuwait |
686.84 | 0.162 | 56 | 12.265 |
 Bosnia and Herzegovina Bosnia and Herzegovina |
497 | 0.131 | 142 | 3.5 |
 Montenegro Montenegro |
381.54 | 0.613 | 170 | 2.244 |
 Uzbekistan Uzbekistan |
116.83 | 0.004 | 137 | 0.853 |
 Malta Malta |
20 | 0.042 | 190 | 0.105 |
Top Olive Producing Countries by Share
- Spain accounts for a significant 25.1% of the world's olive production, underscoring its dominance in the sector.
- Greece contributes approximately 15% of global olive production, reflecting its critical role in the industry.
- Italy holds an 11.8% share in global production, staying as one of the top producers.
- Turkey represents 7.5% of the total global production, highlighting its importance in the olive market.
- Together, these top producers represent over 50% of the world's olive production, showcasing the concentration of production in a few key regions.